Fig. 6
Download original image
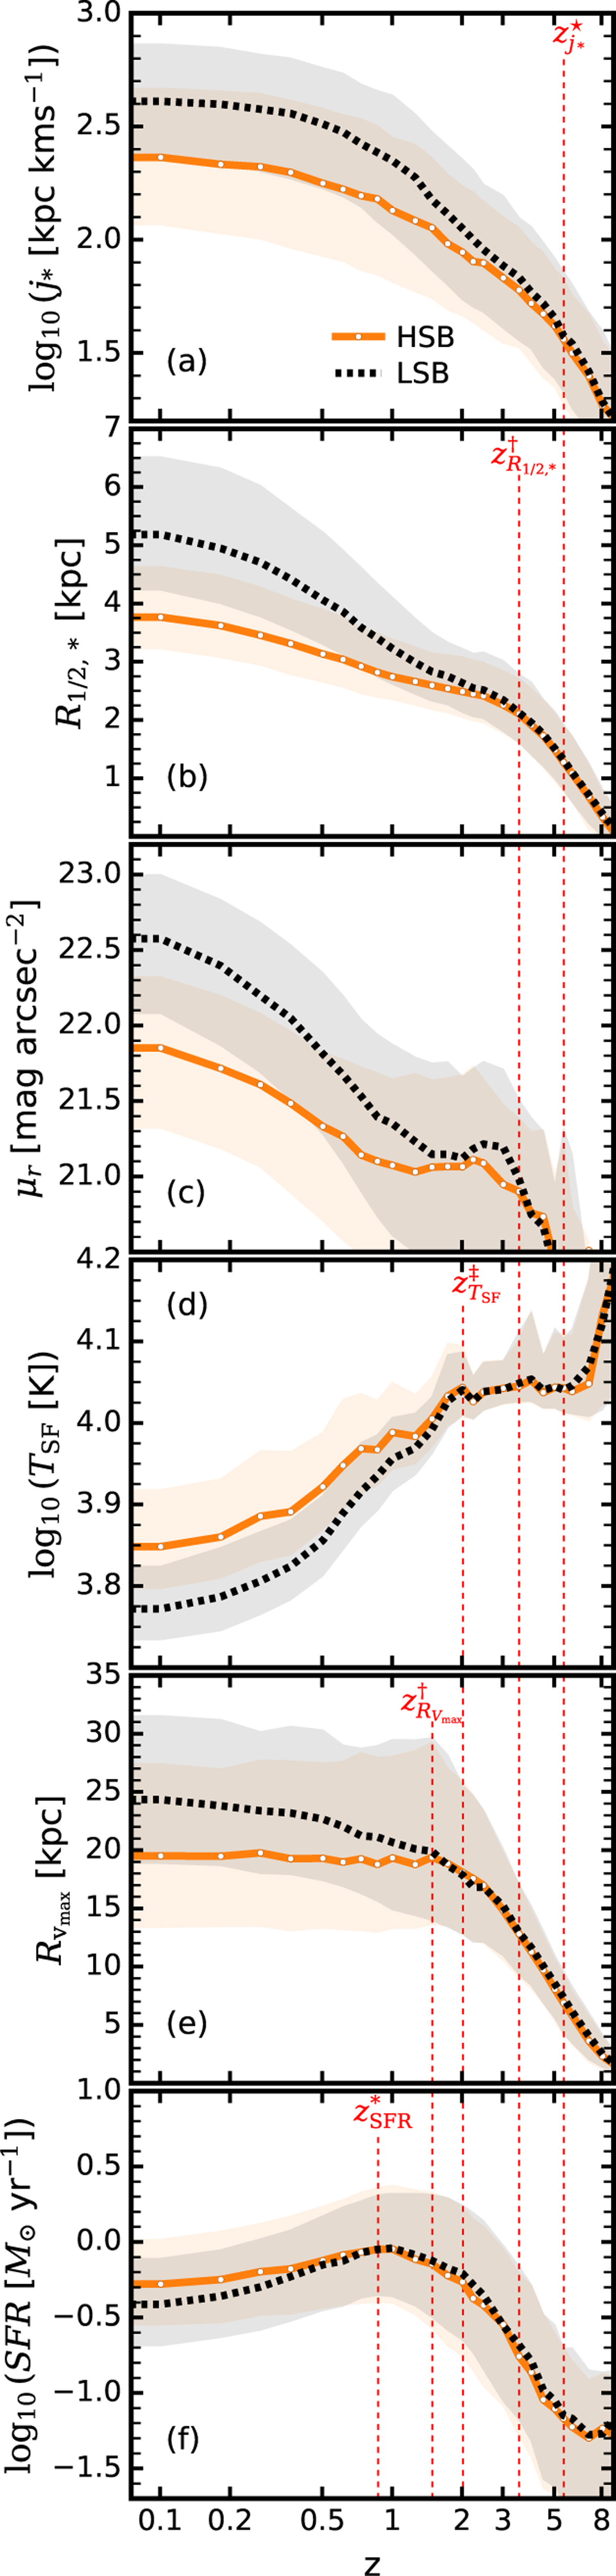
Redshift evolution of the median values for LSBs and HSBs displayed from top to bottom for j*, R1/2,*, μr, TSF, ![]() , and SFR. The order of the plots corresponds to the sequence of divergence events in their histories, as marked by vertical dashed red lines with annotations (see Table 1). See Fig. 5 for colour and symbol coding, and statistical definitions.
, and SFR. The order of the plots corresponds to the sequence of divergence events in their histories, as marked by vertical dashed red lines with annotations (see Table 1). See Fig. 5 for colour and symbol coding, and statistical definitions.
Current usage metrics show cumulative count of Article Views (full-text article views including HTML views, PDF and ePub downloads, according to the available data) and Abstracts Views on Vision4Press platform.
Data correspond to usage on the plateform after 2015. The current usage metrics is available 48-96 hours after online publication and is updated daily on week days.
Initial download of the metrics may take a while.