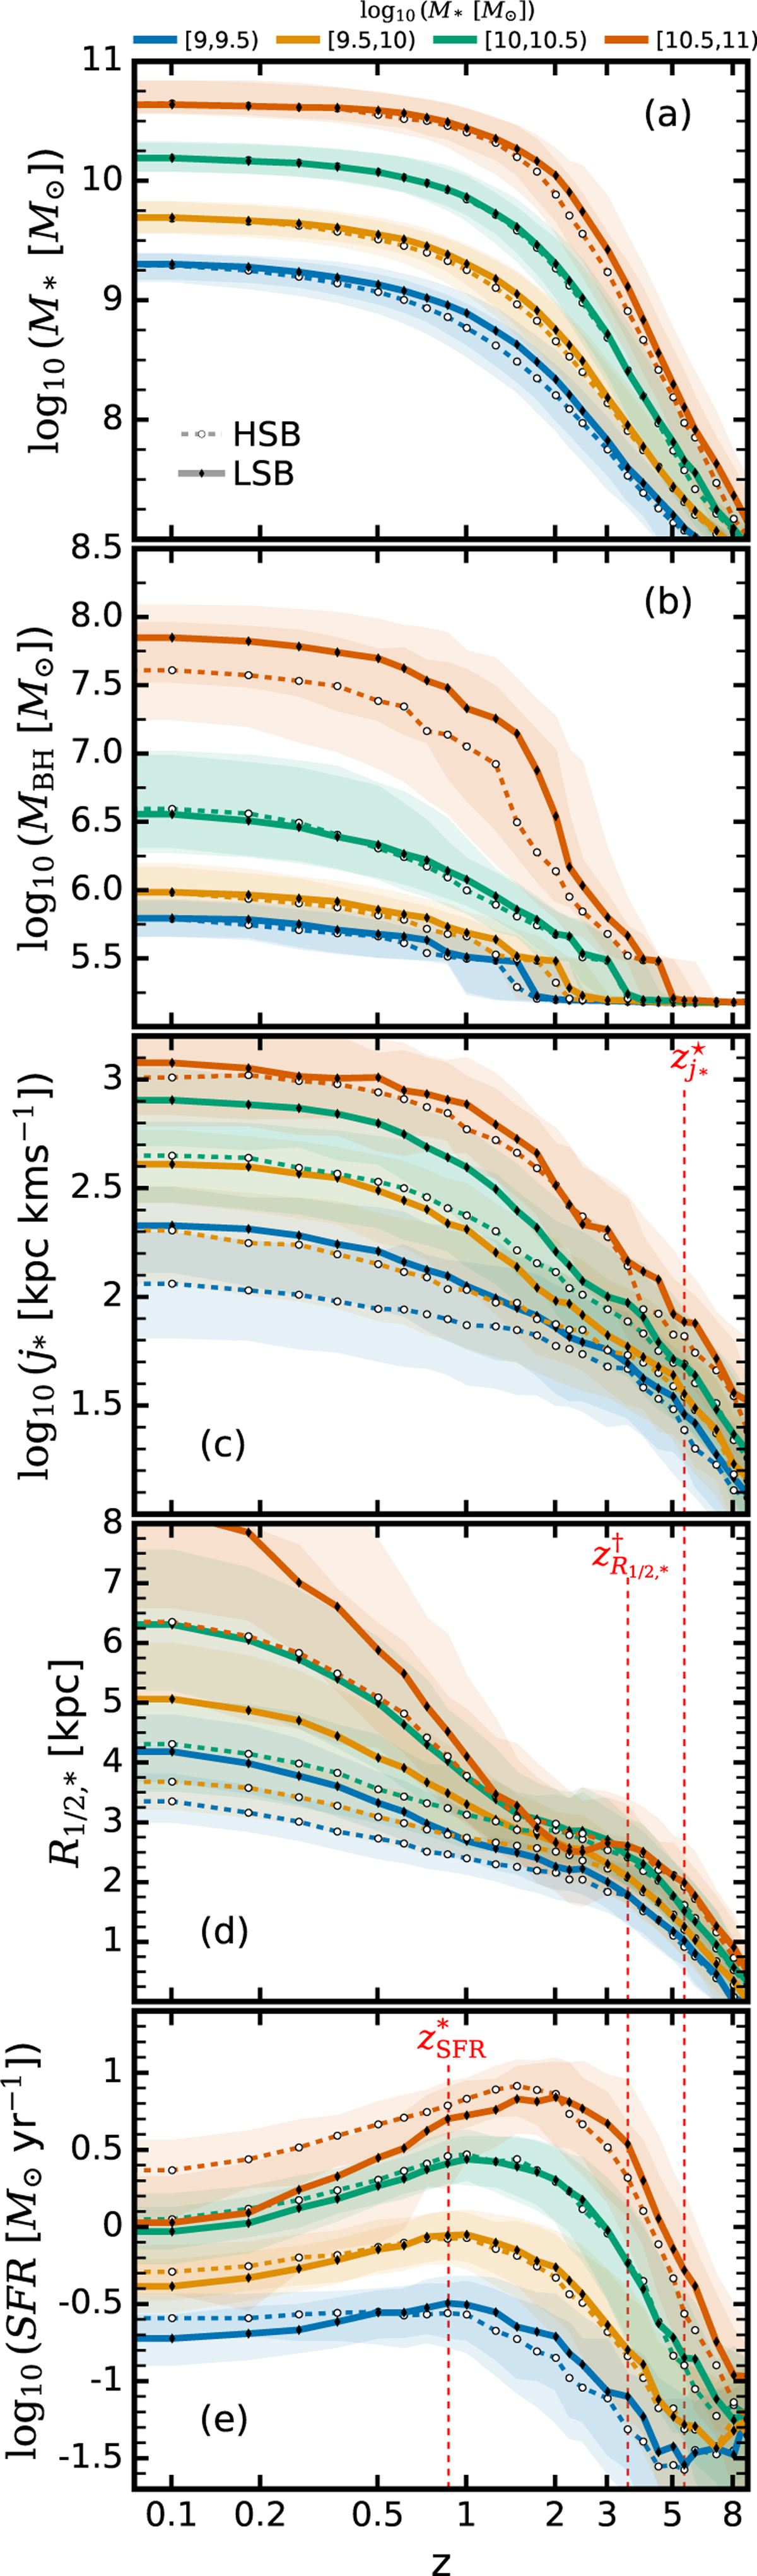
Fig. 7
Download original image
Redshift evolution of the median values alongside the 25th to 75th percentiles of M*, MBH, j*, R1/2,*, and SFR (from top to bottom), binned by stellar mass at ɀ = 0. LSBs are shown as solid thick coloured lines with black diamond markers, while HSBs are represented by dashed thin coloured lines with white circular markers. Vertical dashed red lines with annotations represent the divergence events as described in Table 1.
Current usage metrics show cumulative count of Article Views (full-text article views including HTML views, PDF and ePub downloads, according to the available data) and Abstracts Views on Vision4Press platform.
Data correspond to usage on the plateform after 2015. The current usage metrics is available 48-96 hours after online publication and is updated daily on week days.
Initial download of the metrics may take a while.