Fig. 9
Download original image
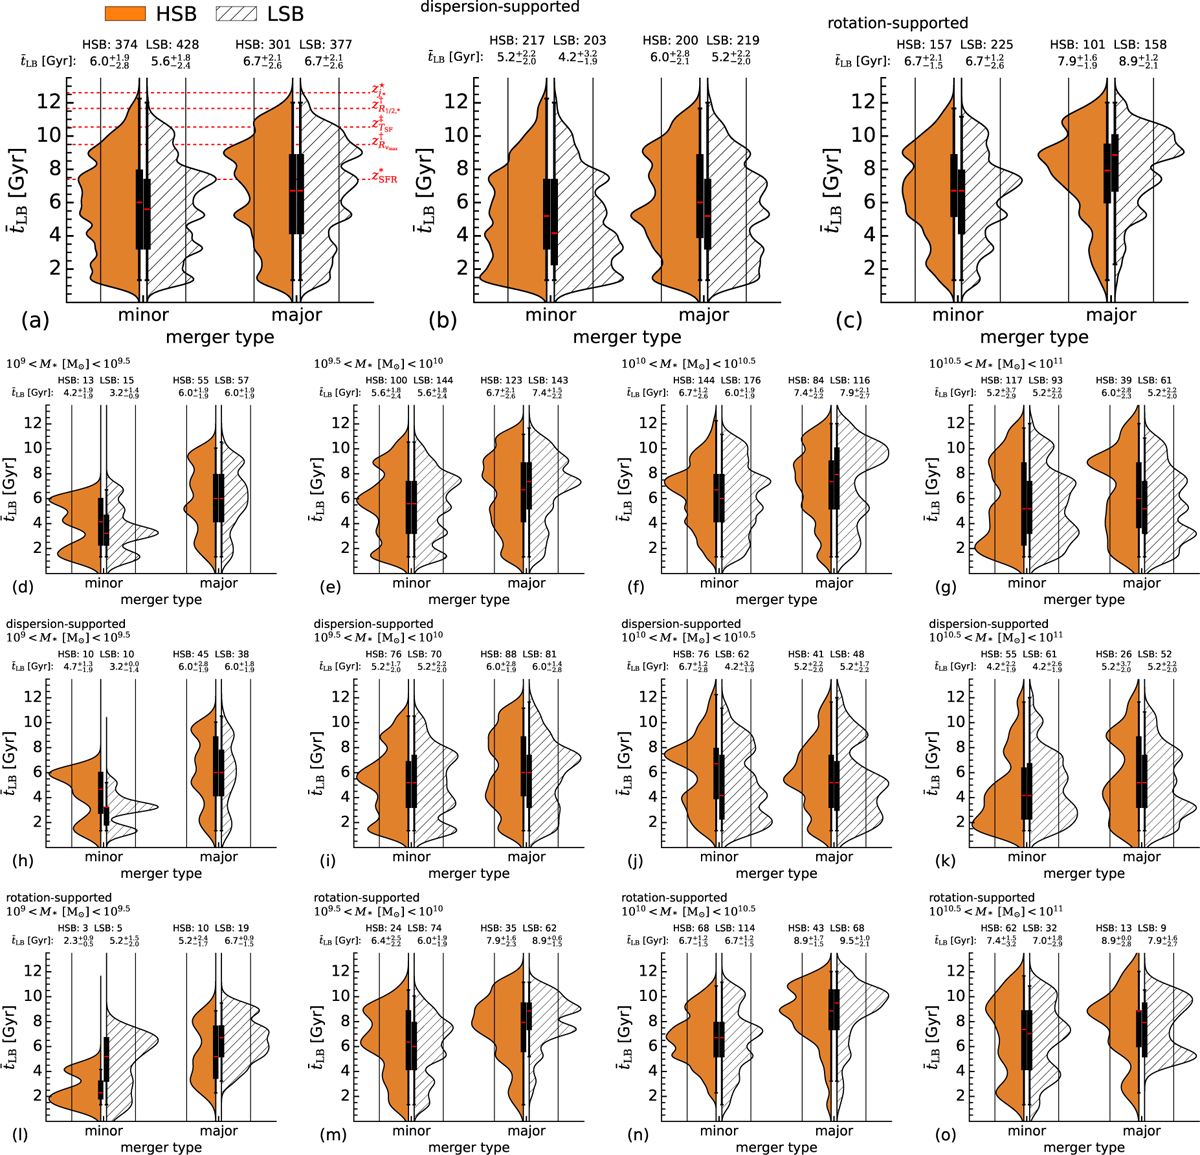
PDFs of last ![]() for minor and major mergers, showing distributions for the full LSB and HSB populations (panel a), dispersion-supported (panel b) and rotation-supported galaxies (panel c). Panels d–g show the distributions binned by stellar mass, while panels h–k and l–o further divide the sample by stellar mass and dynamical state, for dispersion-supported and rotation-supported galaxies, respectively. HSBs are represented by solid orange bars and LSBs are as white bars with diagonal hatching. To aid visual interpretation of number densities, we include mirrored vertical black lines along the boxes. In panel a, the horizontal red dashed lines with annotations mark the look-back times of the divergence events listed in Table 1. For statistical definitions, refer to Section 2.2.
for minor and major mergers, showing distributions for the full LSB and HSB populations (panel a), dispersion-supported (panel b) and rotation-supported galaxies (panel c). Panels d–g show the distributions binned by stellar mass, while panels h–k and l–o further divide the sample by stellar mass and dynamical state, for dispersion-supported and rotation-supported galaxies, respectively. HSBs are represented by solid orange bars and LSBs are as white bars with diagonal hatching. To aid visual interpretation of number densities, we include mirrored vertical black lines along the boxes. In panel a, the horizontal red dashed lines with annotations mark the look-back times of the divergence events listed in Table 1. For statistical definitions, refer to Section 2.2.
Current usage metrics show cumulative count of Article Views (full-text article views including HTML views, PDF and ePub downloads, according to the available data) and Abstracts Views on Vision4Press platform.
Data correspond to usage on the plateform after 2015. The current usage metrics is available 48-96 hours after online publication and is updated daily on week days.
Initial download of the metrics may take a while.