Fig. 1.
Download original image
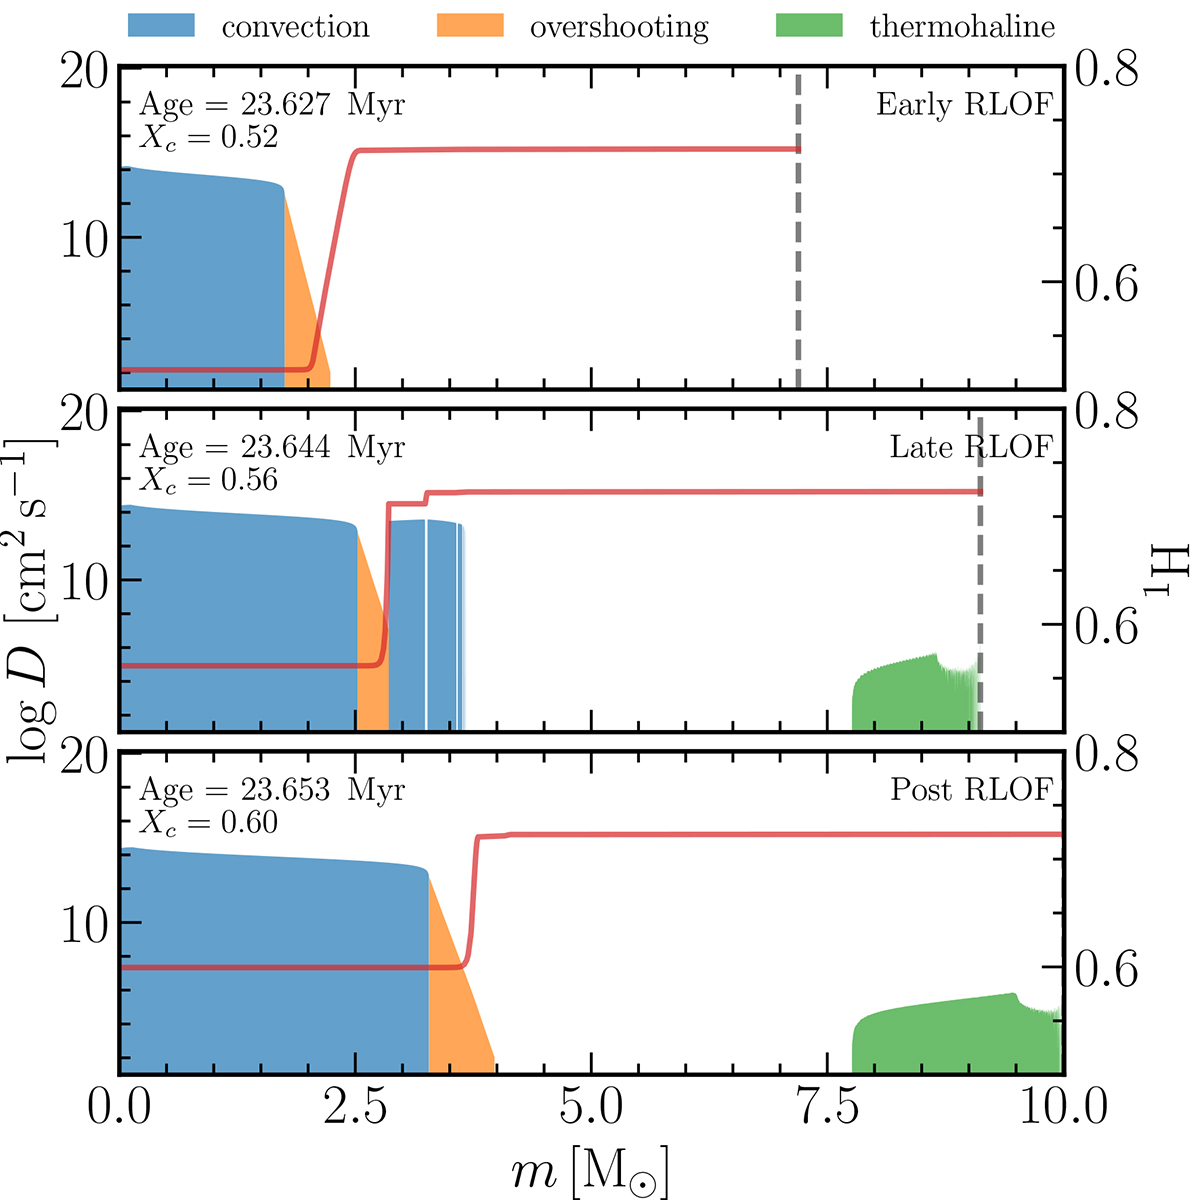
Internal mixing profiles and hydrogen abundance distributions (red lines) for three evolutionary stages: early, late, and post-mass transfer. The coloured regions correspond to different mixing processes, including convection, overshooting, and thermohaline mixing, as labelled. The red solid lines show the internal hydrogen profiles, and the dashed vertical lines show current stellar mass.
Current usage metrics show cumulative count of Article Views (full-text article views including HTML views, PDF and ePub downloads, according to the available data) and Abstracts Views on Vision4Press platform.
Data correspond to usage on the plateform after 2015. The current usage metrics is available 48-96 hours after online publication and is updated daily on week days.
Initial download of the metrics may take a while.