Fig. 1.
Download original image
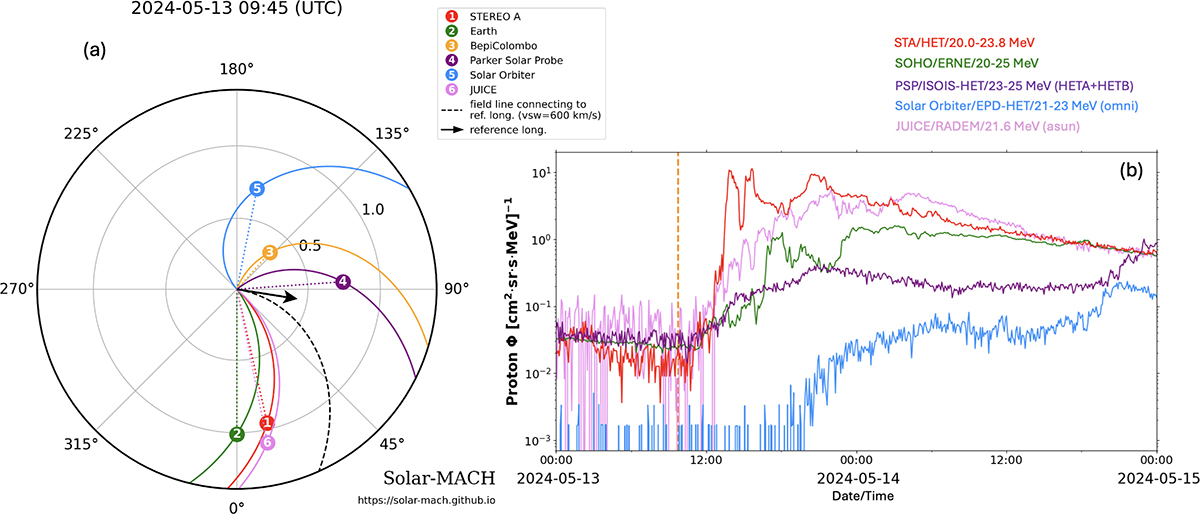
Spatial distribution of spacecraft and their magnetic connectivity at 09:45 UT on 13 May 2024, along with SEP observations from multiple spacecraft. (a) The spacecraft constellation was produced using the Solar-MACH tool (Gieseler et al. 2023), which is accessible online https://doi.org/10.5281/zenodo.7016783. The solar wind speeds applied at various positions are derived from a combination of in situ measurements and estimated values, as detailed in the main text. (b) Proton intensities near 22 MeV recorded by the different spacecraft are shown. The orange vertical line marks the time of the flare’s soft X-ray peak (around 09:44 UT), which is associated with the observed SEP event.
Current usage metrics show cumulative count of Article Views (full-text article views including HTML views, PDF and ePub downloads, according to the available data) and Abstracts Views on Vision4Press platform.
Data correspond to usage on the plateform after 2015. The current usage metrics is available 48-96 hours after online publication and is updated daily on week days.
Initial download of the metrics may take a while.