Fig. 10
Download original image
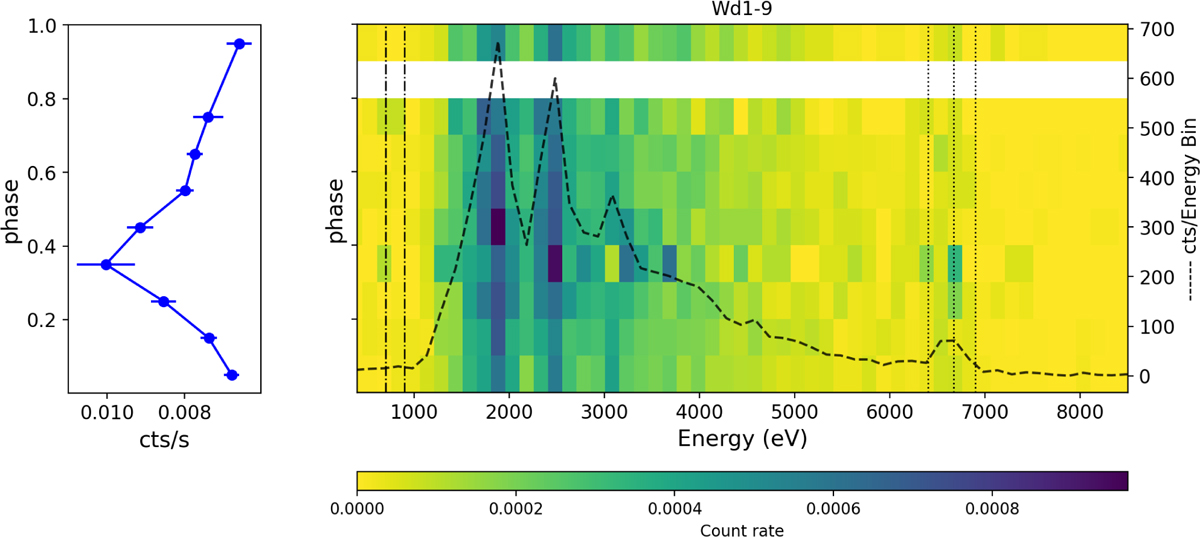
Spectral phase map of Wd1-9 using all EWOCS observations. Left panel: Phase-folded light curve of Wd1-9, highlighting the contribution of broadband events in the various phase bins. Right panel: Phase-folded combined event file, binned over phase and energy range and normalised by the corresponding exposure time. Different colours represent varying count rates, as is indicated by the colour bar below. The white stripe represents a phase bin with no available observations. The dashed line illustrates the summed counts in each energy bin (exact values are shown at the right y axis), providing a general representation of the spectrum and the dominant emission lines. The dotted lines on the right mark the peak emission from Fe Kα, Fe XXV, and Fe XXVI lines. On the left, dash-dotted lines indicate the energy range where excess soft emission is observed.
Current usage metrics show cumulative count of Article Views (full-text article views including HTML views, PDF and ePub downloads, according to the available data) and Abstracts Views on Vision4Press platform.
Data correspond to usage on the plateform after 2015. The current usage metrics is available 48-96 hours after online publication and is updated daily on week days.
Initial download of the metrics may take a while.