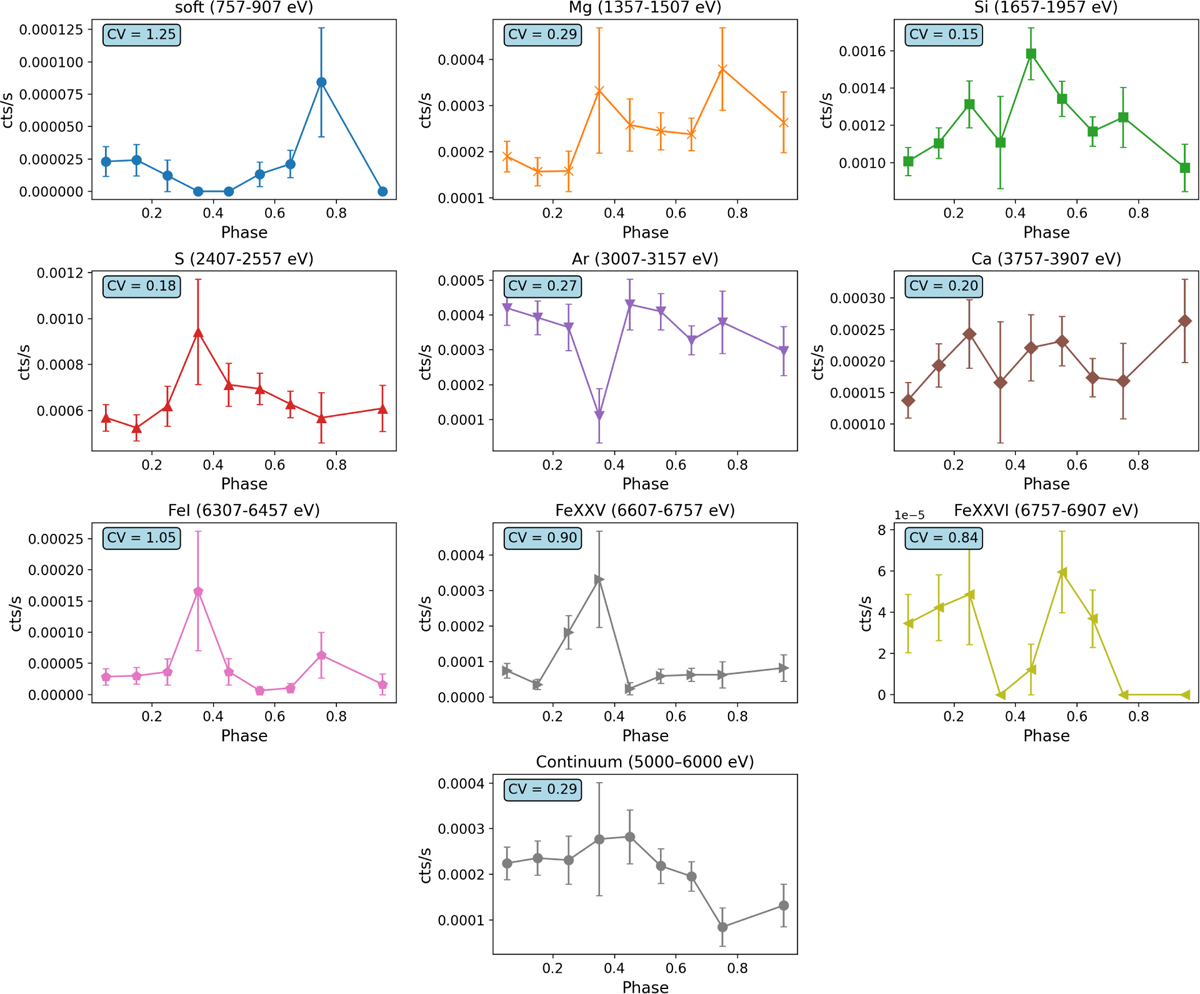
Fig. 11
Download original image
Phase-dependent variation of the total (line plus continuum) count rate in energy bands centred on selected emission lines. The CV is defined as the ratio of the standard deviation to the mean count rate, serving as a measure of emission variability across phase in each energy range. The last panel shows the light curve extracted from a line-free energy range (5.0–6.0 keV), representative of the underlying continuum.
Current usage metrics show cumulative count of Article Views (full-text article views including HTML views, PDF and ePub downloads, according to the available data) and Abstracts Views on Vision4Press platform.
Data correspond to usage on the plateform after 2015. The current usage metrics is available 48-96 hours after online publication and is updated daily on week days.
Initial download of the metrics may take a while.