Fig. 6
Download original image
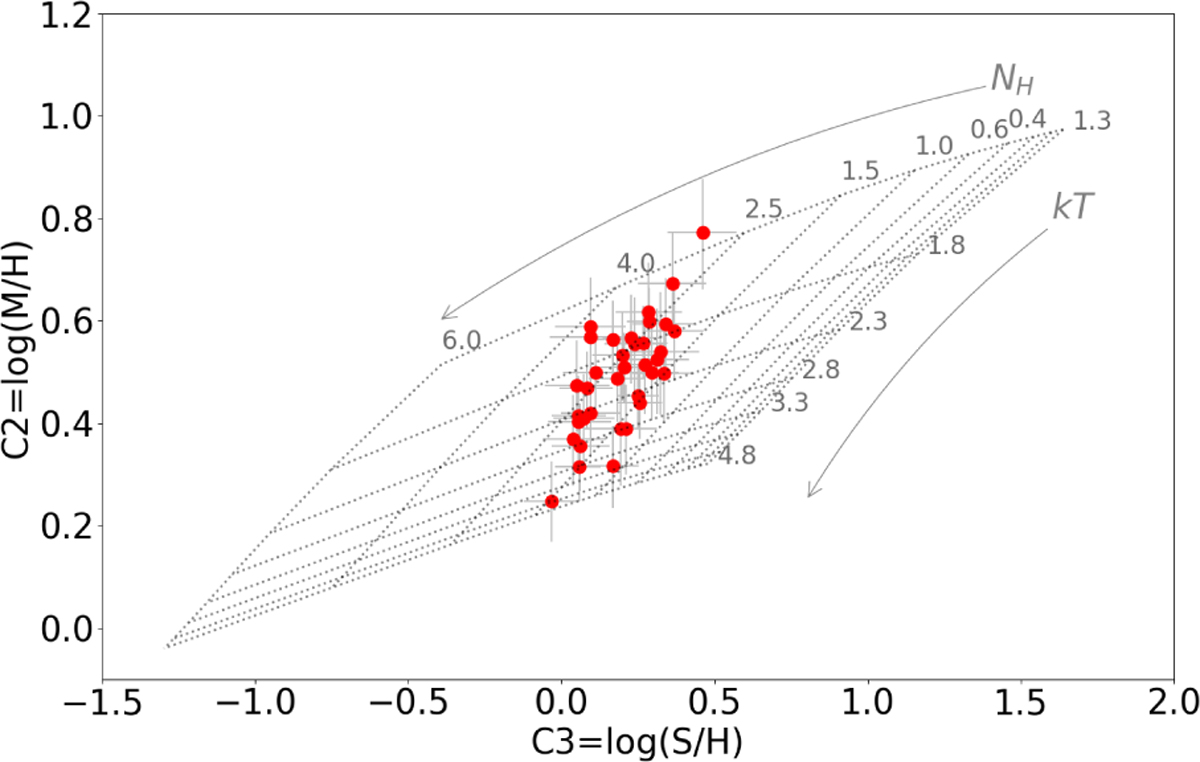
X-ray colour-colour diagram for Wd1-9. S, M, and H represent the net counts in the soft (0.5–2.0 keV), medium (2.0–4.0 keV), and hard (4.0–8.0 keV) bands, respectively. The 36 EWOCS observations are shown with red circles along with their 1σ error bars. The grey-dotted grid and the NH and kT values correspond to the results of simulated absorbed thermal spectra (model used: tbabs×apec).
Current usage metrics show cumulative count of Article Views (full-text article views including HTML views, PDF and ePub downloads, according to the available data) and Abstracts Views on Vision4Press platform.
Data correspond to usage on the plateform after 2015. The current usage metrics is available 48-96 hours after online publication and is updated daily on week days.
Initial download of the metrics may take a while.