Open Access
Fig. 7
Download original image
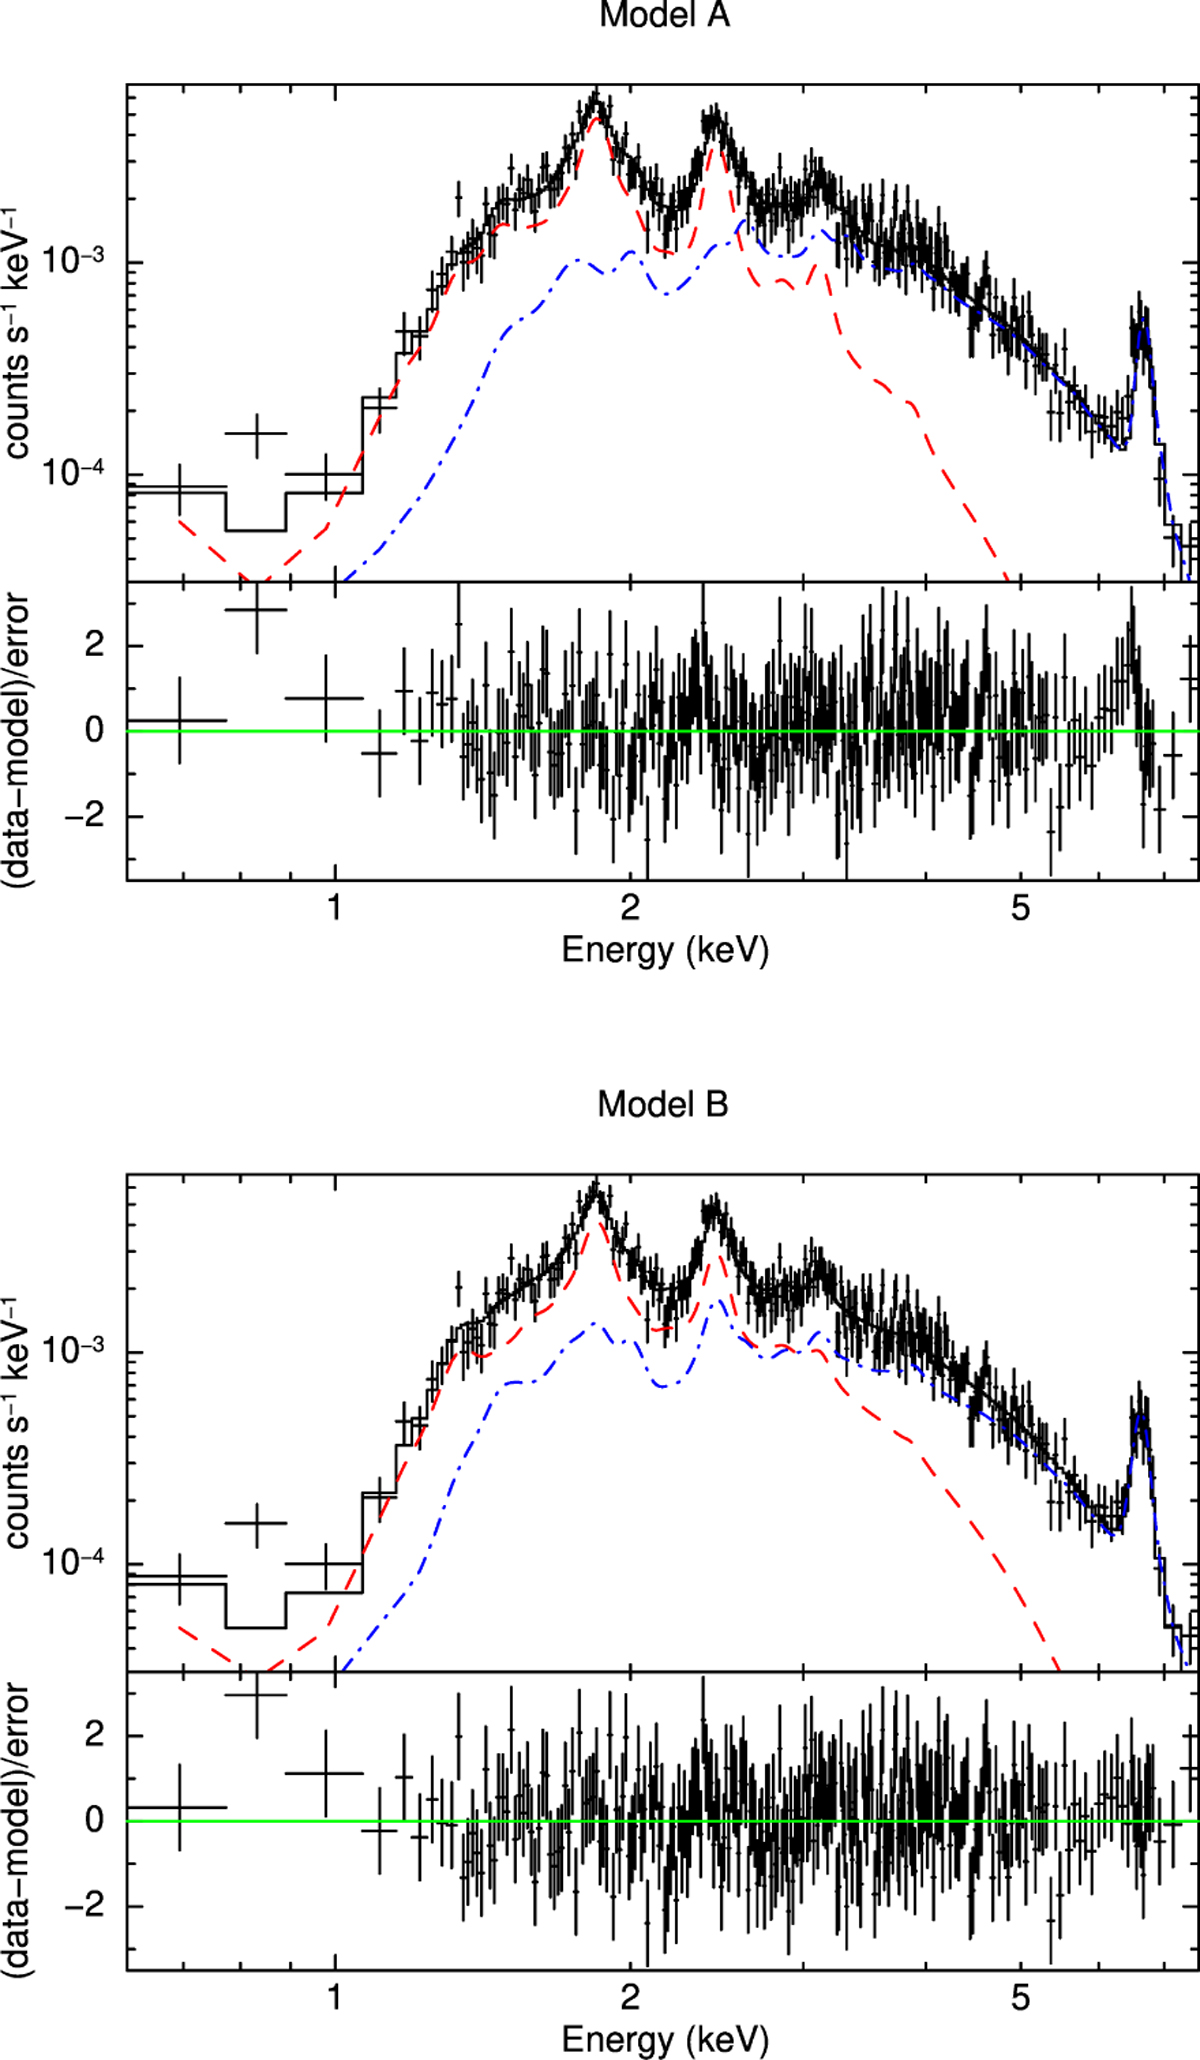
Spectral modelling of Wd1-9 using Model A (top) and Model B (bottom). The contributions of the soft and hard thermal components are shown with dashed red and dash-dotted blue lines, respectively. The errors correspond to the 1σ confidence and the residuals are reported in the bottom panel in terms of sigma.
Current usage metrics show cumulative count of Article Views (full-text article views including HTML views, PDF and ePub downloads, according to the available data) and Abstracts Views on Vision4Press platform.
Data correspond to usage on the plateform after 2015. The current usage metrics is available 48-96 hours after online publication and is updated daily on week days.
Initial download of the metrics may take a while.