Fig. 6
Download original image
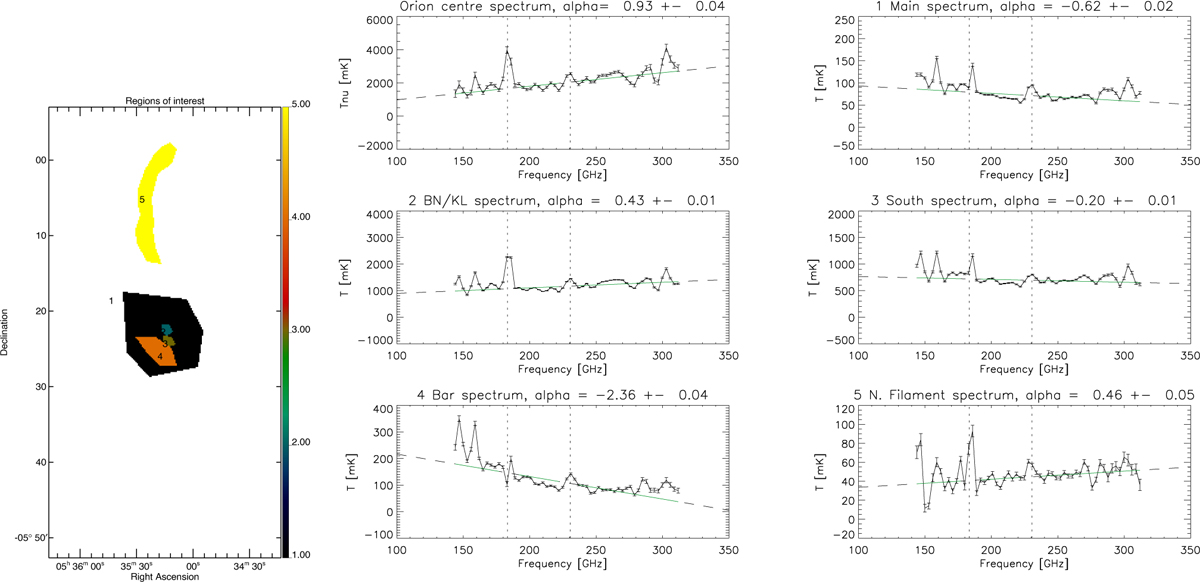
Spectrum of selected regions in Orion. The left figure shows the selected regions in equatorial coordinates with their labels. The average spectra of these regions are presented in the right panels, the first of which corresponds to the spectrum of the 10 arcsec pixel of the Orion peak at 5:35:14–5:22:30. The green curve is a linear fit to the continuum from 144 to 312 GHz, excluding the CO and H2O lines at 230.5 and 183.3 GHz. The resulting power-law index α at 250 GHz (as defined in Eq. (9)) is given in the panel title. The values differ from those in Table 2 because of the different frequency range. The CO(2-1) line is clearly detected at 230.5 GHz, and the water-vapour line is also apparent at 183.3 GHz, as indicated by the two vertical dotted lines).
Current usage metrics show cumulative count of Article Views (full-text article views including HTML views, PDF and ePub downloads, according to the available data) and Abstracts Views on Vision4Press platform.
Data correspond to usage on the plateform after 2015. The current usage metrics is available 48-96 hours after online publication and is updated daily on week days.
Initial download of the metrics may take a while.