Fig. 7
Download original image
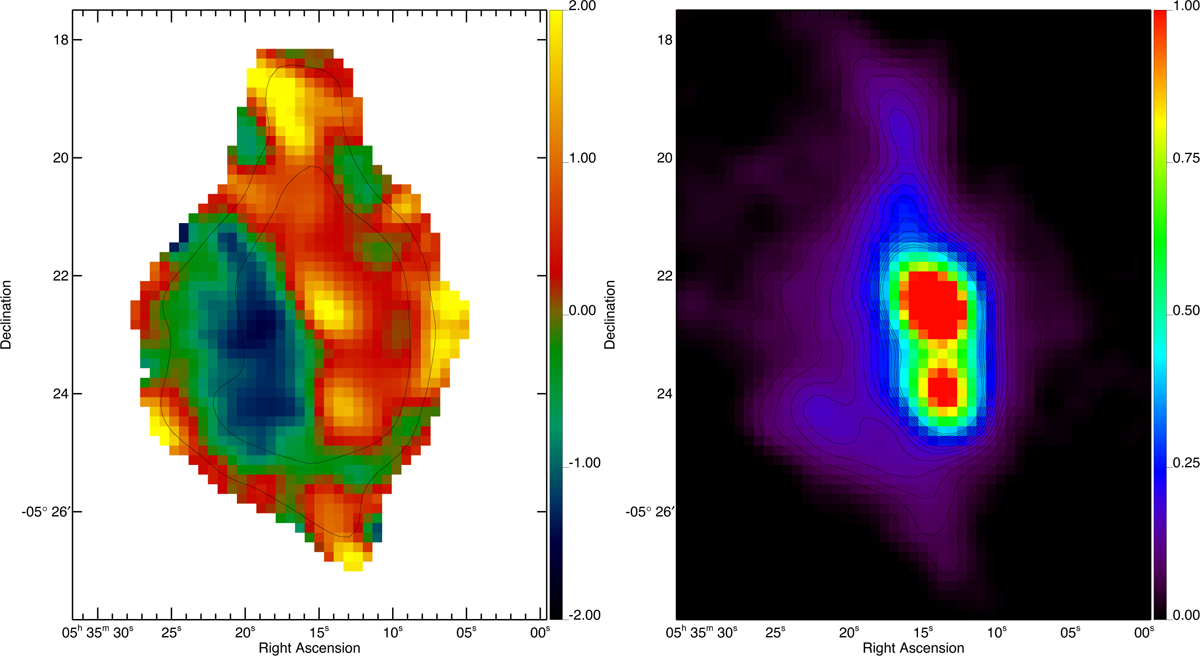
Left: map of the power-law index α250 , centred at 250 GHz, of the continuum brightness temperature in Orion (see Eq. (8)), after convolution to a resolution of 40 arcseconds, focussing on the Orion Centre. The power-law index is uncontaminated by the CO line. Contours indicate uncertainties of 0.3 (inner) and 0.6 (outer) for α250 within one beam. The map is clipped at an uncertainty of 1. Right: map of the 250 GHz continuum in kelvins at a 40 arcsec resolution. The S/N is labelled on the contours in steps of 5, with a typical noise of 6 mK.
Current usage metrics show cumulative count of Article Views (full-text article views including HTML views, PDF and ePub downloads, according to the available data) and Abstracts Views on Vision4Press platform.
Data correspond to usage on the plateform after 2015. The current usage metrics is available 48-96 hours after online publication and is updated daily on week days.
Initial download of the metrics may take a while.