Fig. 8
Download original image
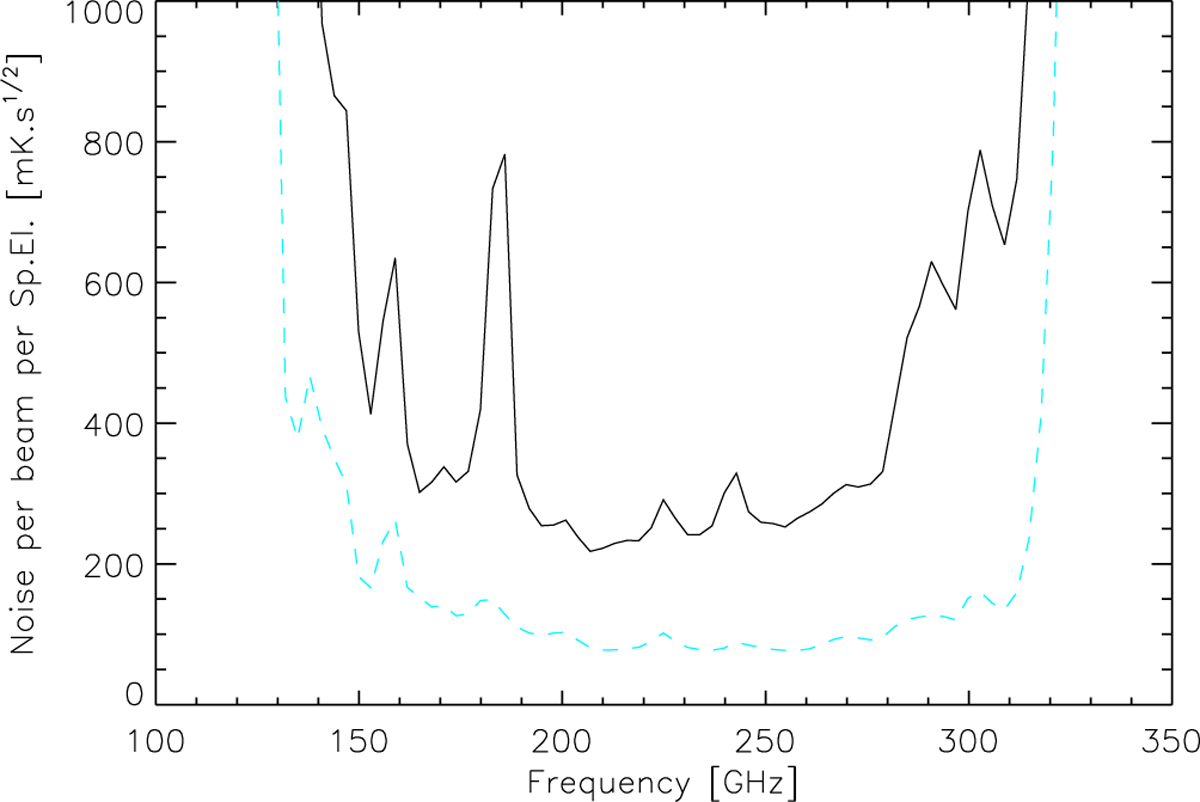
Spectral sensitivity of CONCERTO. For a one second integration and a reference beam of 30 arcsec FWHM, the noise level is shown as a function of frequency (solid black curve) per spectral element of 3 GHz, for an average pwv of 0.4 mm. The dashed cyan curve represents the instrumental noise, estimated with the measured noise outside the CONCERTO bandpass, extrapolated to CONCERTO frequencies assuming white noise, and converted to physical units using the spectroscopic response without atmospheric correction.
Current usage metrics show cumulative count of Article Views (full-text article views including HTML views, PDF and ePub downloads, according to the available data) and Abstracts Views on Vision4Press platform.
Data correspond to usage on the plateform after 2015. The current usage metrics is available 48-96 hours after online publication and is updated daily on week days.
Initial download of the metrics may take a while.