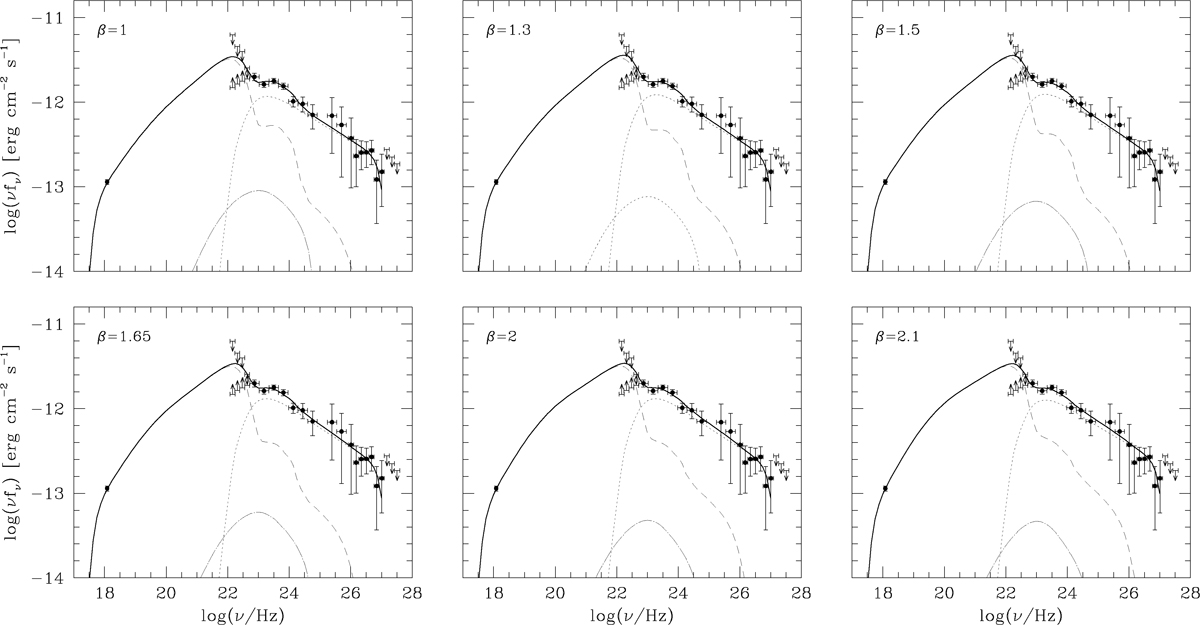
Fig. 1.
Download original image
X-ray/γ-ray range of the CSB SED. The emission model (thick solid curve), including total (i.e., primary plus secondary) Compton/M82-EBL-CMB radiation (dashed curve) and NT bremsstrahlung (dash-dotted curve), and a pionic component (dotted curve), is overlaid with data from Tables 2–4 (black dots). The leptonic component is dominated by the Comptonization of the local FIR radiation. The 5 keV flux, resulting from the NT 4−8 keV flux measured by Iwasawa et al. (2023), is fit by (basically) the local Compton/FIR yield, in which the secondary electron spectrum is uniquely set by the CRp spectrum fit to the γ-ray data and the primary-electron spectrum is normalized to match the 5 keV flux.
Current usage metrics show cumulative count of Article Views (full-text article views including HTML views, PDF and ePub downloads, according to the available data) and Abstracts Views on Vision4Press platform.
Data correspond to usage on the plateform after 2015. The current usage metrics is available 48-96 hours after online publication and is updated daily on week days.
Initial download of the metrics may take a while.