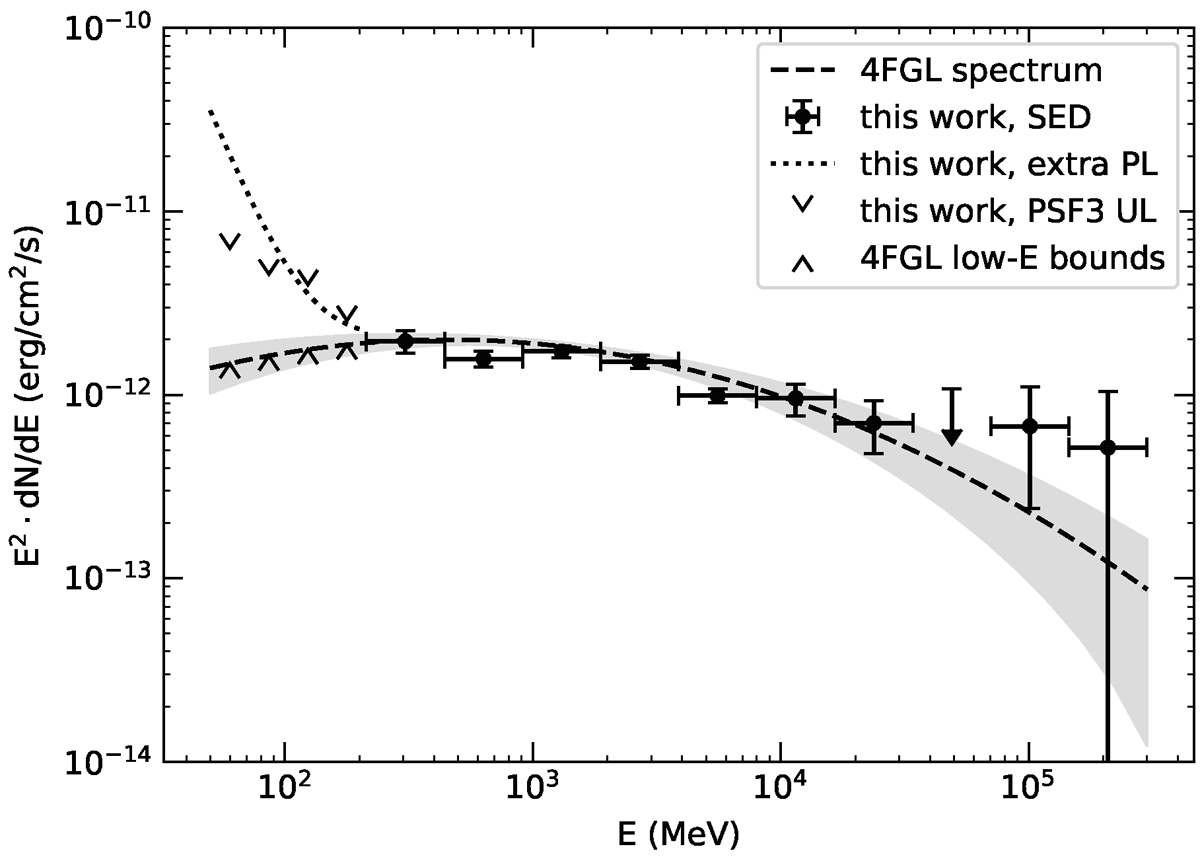
Fig. A.1.
Download original image
M82 spectral model. Dashed line: 4FGL spectrum with 1σ uncertainties (gray band). Data points: SED points derived assuming 4FGL spectrum, with 1σ uncertainties. Dotted line: 4FGL spectrum plus the low-energy PL component. Downward triangles: low-energy upper limits from the PSF3 analysis. Upward triangles: low-energy lower bounds, flux values from 4FGL model.
Current usage metrics show cumulative count of Article Views (full-text article views including HTML views, PDF and ePub downloads, according to the available data) and Abstracts Views on Vision4Press platform.
Data correspond to usage on the plateform after 2015. The current usage metrics is available 48-96 hours after online publication and is updated daily on week days.
Initial download of the metrics may take a while.