Open Access
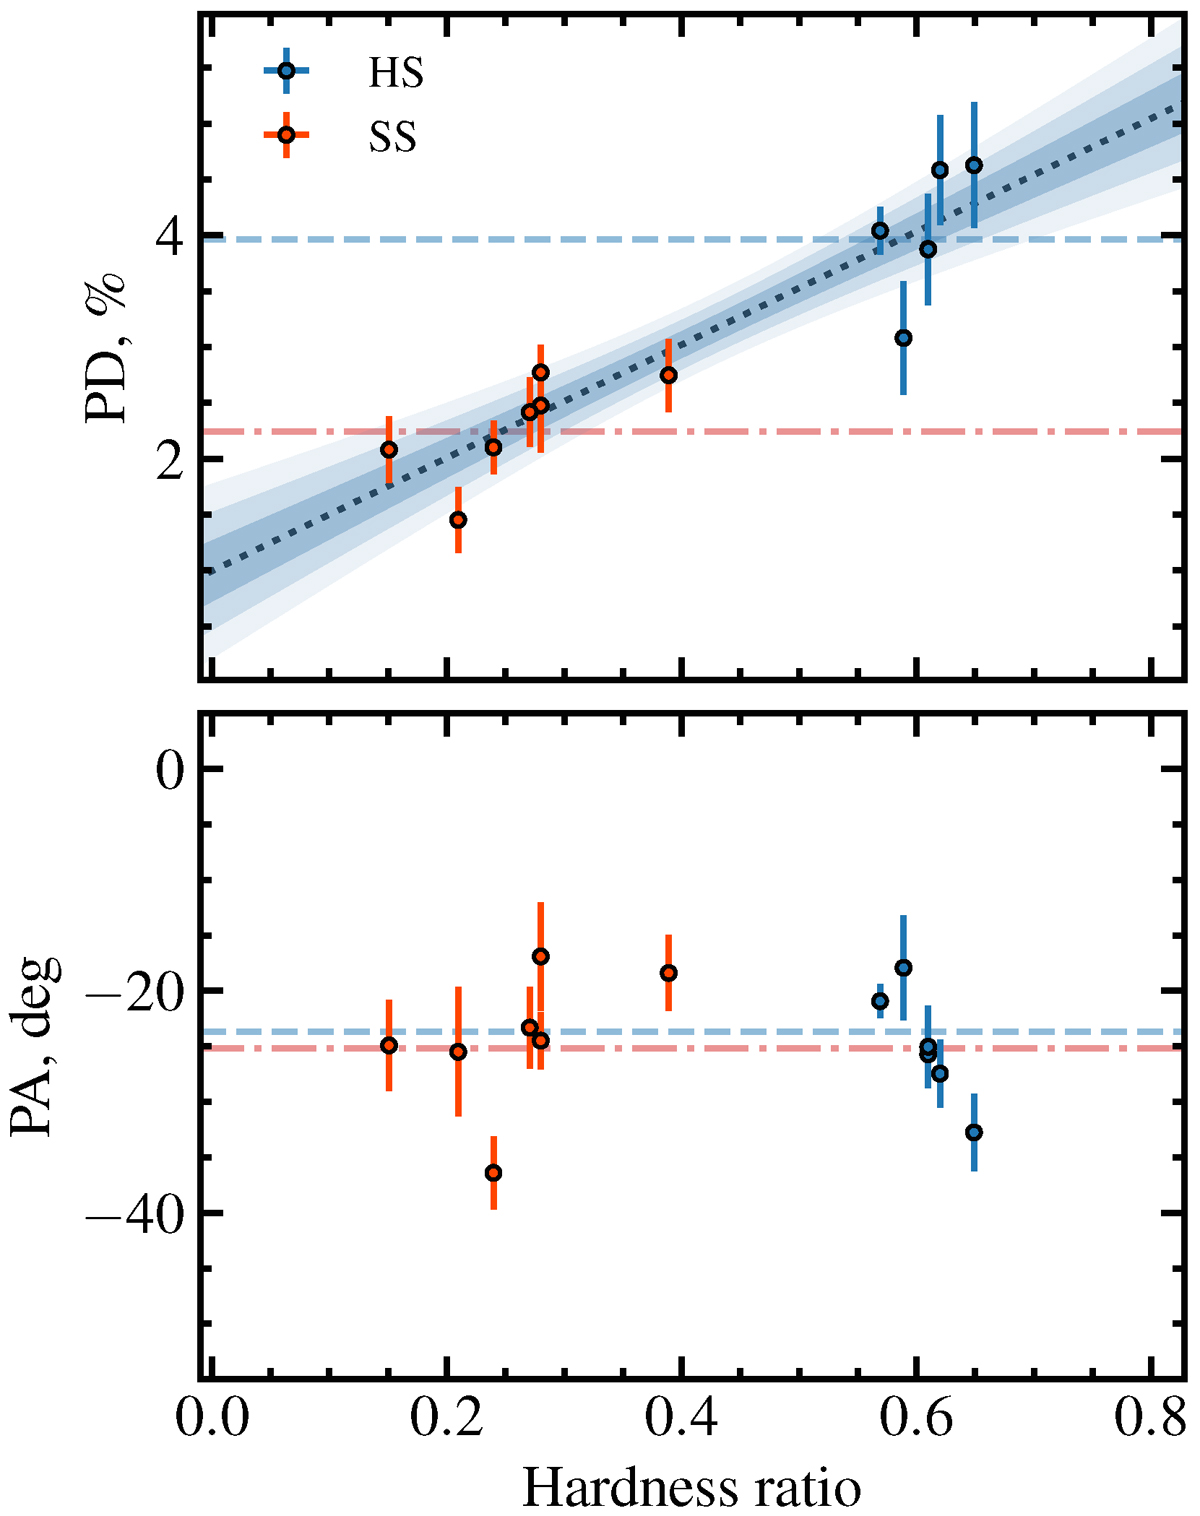
Fig. 4.
Download original image
Dependence of PD and PA of Cyg X-1 on spectral hardness. The dashed and dash-dotted horizontal lines show average values in the hard- and soft-states, respectively. The dotted line with 1, 2, and 3σ confidence intervals shows a linear fit to the PD.
Current usage metrics show cumulative count of Article Views (full-text article views including HTML views, PDF and ePub downloads, according to the available data) and Abstracts Views on Vision4Press platform.
Data correspond to usage on the plateform after 2015. The current usage metrics is available 48-96 hours after online publication and is updated daily on week days.
Initial download of the metrics may take a while.