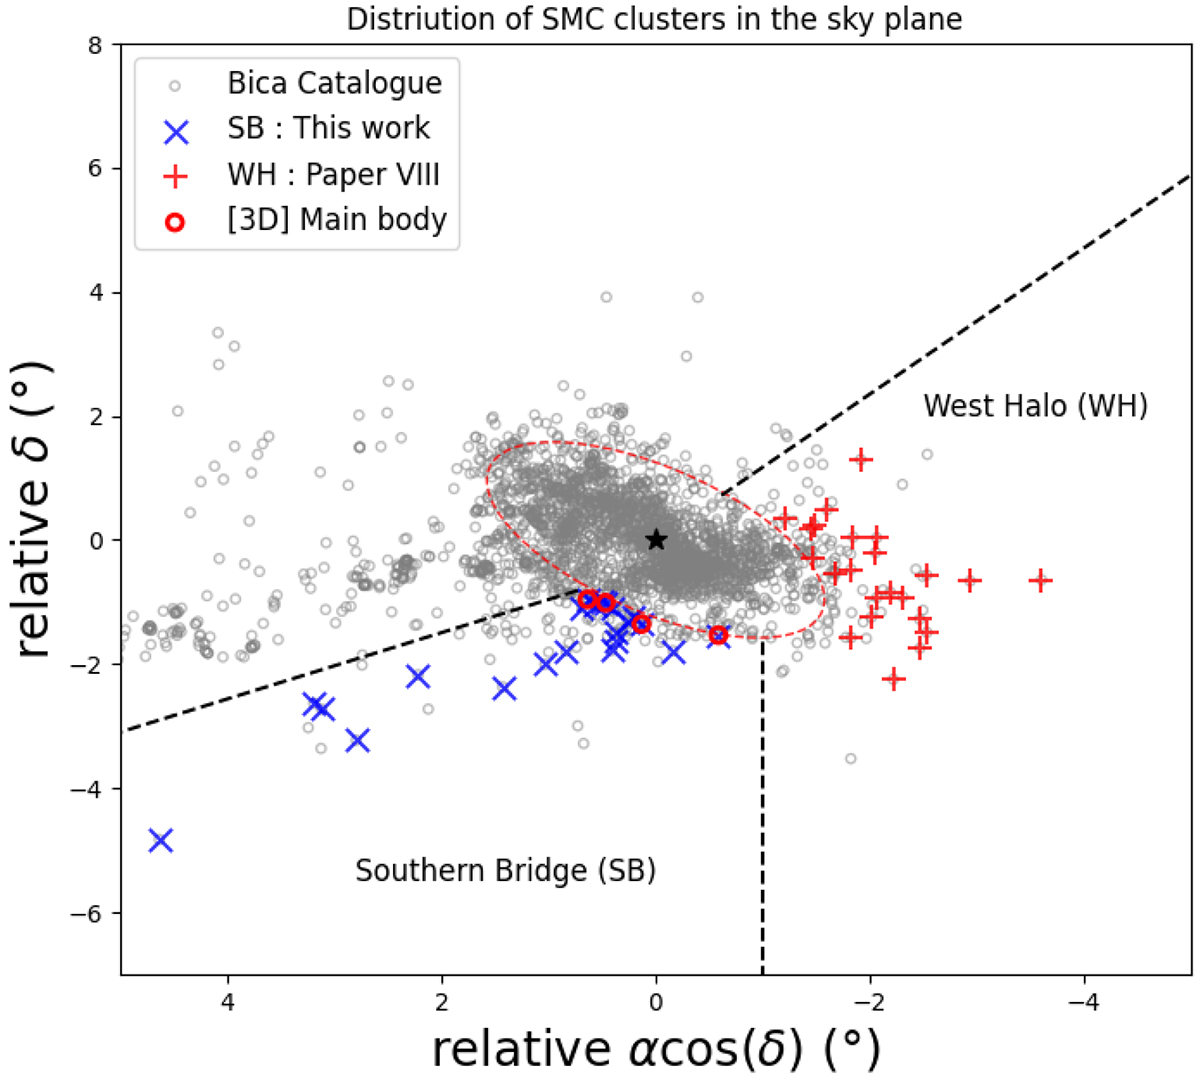
Fig. 1.
Download original image
Two-dimensional (2D) distribution of SMC clusters analyzed in this work (blue crosses), along with those previously examined in Paper VIII and references therein (red crosses), are shown in comparison with the objects cataloged by Bica et al. (2020) as gray circles. The ellipse represents the SMC [2D] main body (explained in Section 2.1) and the dashed lines show the boundaries of these subregions as in Dias et al. 2016, and Paper VII. The red open circles represents the SB clusters that are part of the main body based on the 3D classification (see Paper IV for more details).
Current usage metrics show cumulative count of Article Views (full-text article views including HTML views, PDF and ePub downloads, according to the available data) and Abstracts Views on Vision4Press platform.
Data correspond to usage on the plateform after 2015. The current usage metrics is available 48-96 hours after online publication and is updated daily on week days.
Initial download of the metrics may take a while.