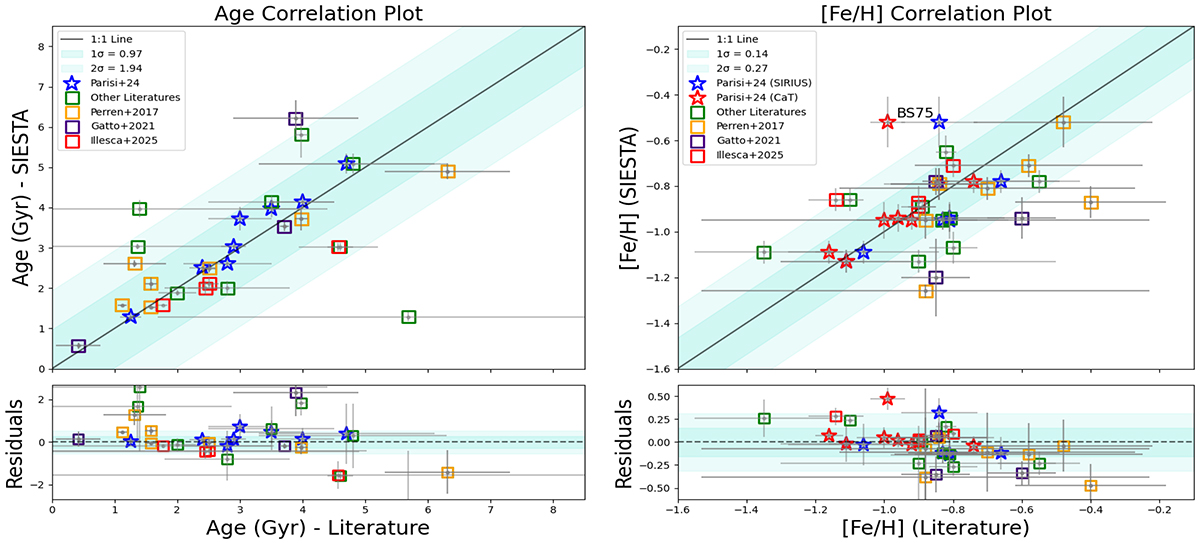
Fig. 2.
Download original image
Correlation plots between the ages (left) and metallicities (right) derived using the SIESTA code is compared with the values from literature excluding previous studies using the VISCACHA data, where the ages and metallicities were derived heterogeneously using different techniques (squares). The blue stars are the ones homogeneously derived by Paper IX using the SIRIUS code, which show good agreement with our estimates. The corresponding residual plots are displayed beneath each main plot. The 1 and 2 sigma regions are shaded to provide a visual representation of the deviations in the correlation plot. Each cluster analyzed in this work has multiple points in the plot from the different literature sources for comparison.
Current usage metrics show cumulative count of Article Views (full-text article views including HTML views, PDF and ePub downloads, according to the available data) and Abstracts Views on Vision4Press platform.
Data correspond to usage on the plateform after 2015. The current usage metrics is available 48-96 hours after online publication and is updated daily on week days.
Initial download of the metrics may take a while.