Fig. 3.
Download original image
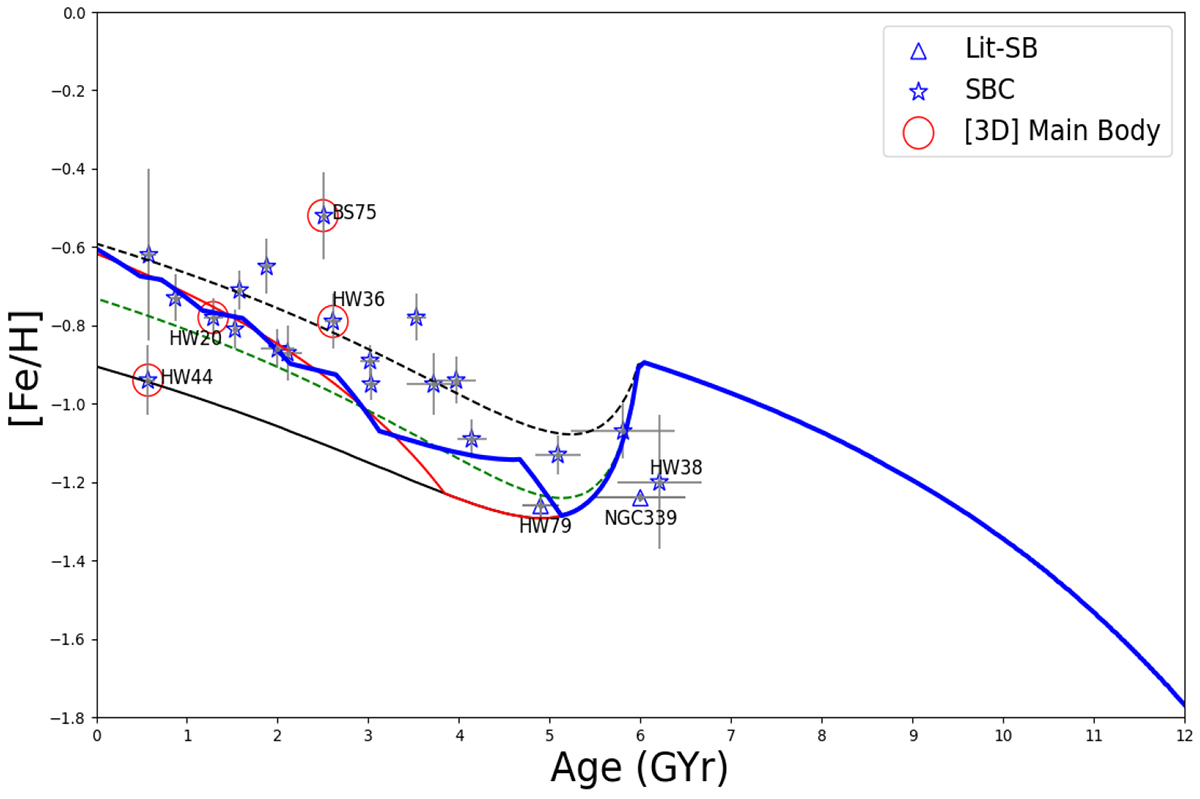
Age metallicity relation (AMR) of the SMC SB clusters. Triangles represent results from an extended sample from the literature. Clusters classified as part of the main body based on the 3D classification are labeled and highlighted with red circles. The green curve is the model for the WH clusters (Paper VIII), representing the major merger 6 Gyr ago resulting in an enhanced SFR. The red curve is similar, but the enhancement in SFR is delayed for 2 Gyr after the major merger. The blue solid line is the major merger model followed by a sequence of bursts, and this is our best fitting model for the WH clusters from Paper VIII. The black thick line depicts the scenario without enhanced star formation after the major merger, whereas the black dotted line is the merger with a mass ratio 1:2.
Current usage metrics show cumulative count of Article Views (full-text article views including HTML views, PDF and ePub downloads, according to the available data) and Abstracts Views on Vision4Press platform.
Data correspond to usage on the plateform after 2015. The current usage metrics is available 48-96 hours after online publication and is updated daily on week days.
Initial download of the metrics may take a while.