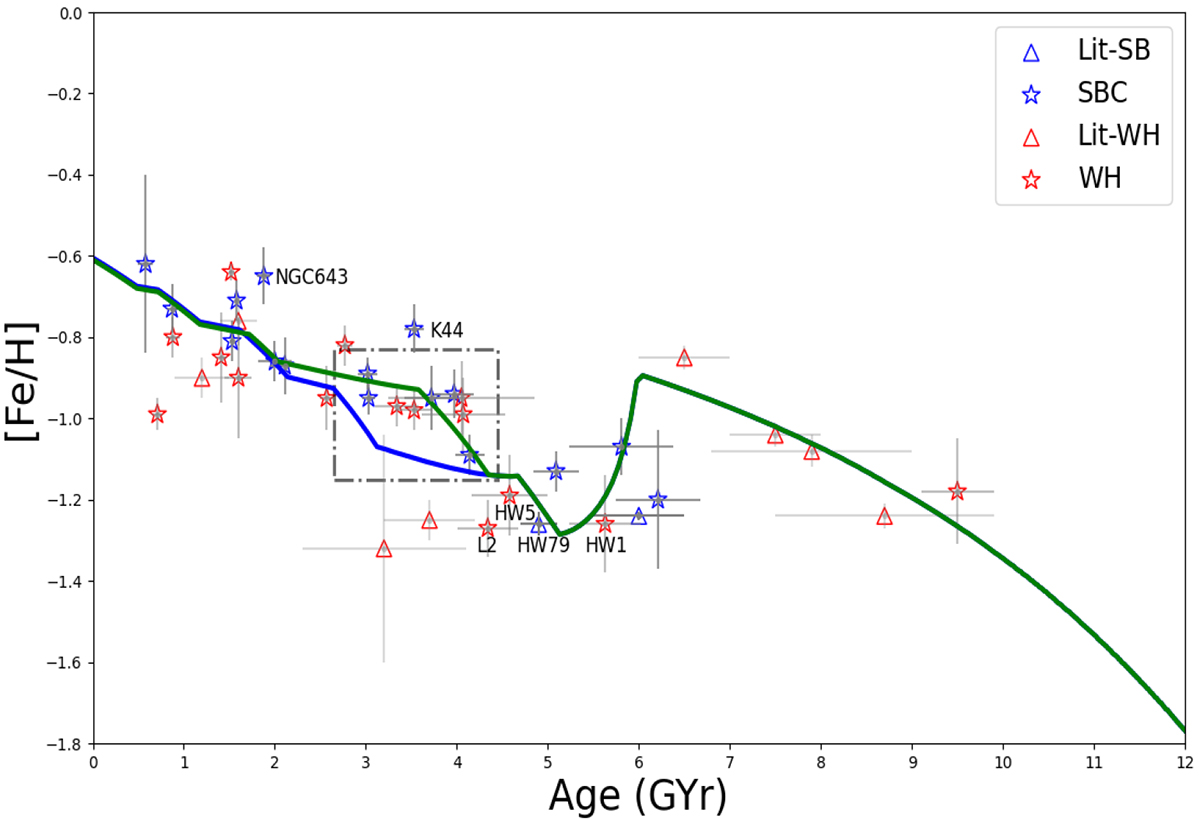
Fig. 4.
Download original image
Comparison between the best-fit model from Paper VIII with the modified one from the current work. The AMR with all the clusters from SB (excluding the ones classified as [3D] main body as shown in Fig. 3) and WH clusters. The best-fitting major merger model from Paper VIII, derived using only the WH clusters, is over plotted as the solid blue line. The green solid line represents our newly modified major merger model, accounting for all the clusters from SB and WH together. This best-fit green solid curve illustrates a merger model with a 1:4 mass ratio 6 Gyr ago, followed by enhanced SFR from multiple bursts as presented in Fig. 5. The region enclosed by the black rectangle highlights the most significant difference between the old (Paper VIII) and new models.
Current usage metrics show cumulative count of Article Views (full-text article views including HTML views, PDF and ePub downloads, according to the available data) and Abstracts Views on Vision4Press platform.
Data correspond to usage on the plateform after 2015. The current usage metrics is available 48-96 hours after online publication and is updated daily on week days.
Initial download of the metrics may take a while.