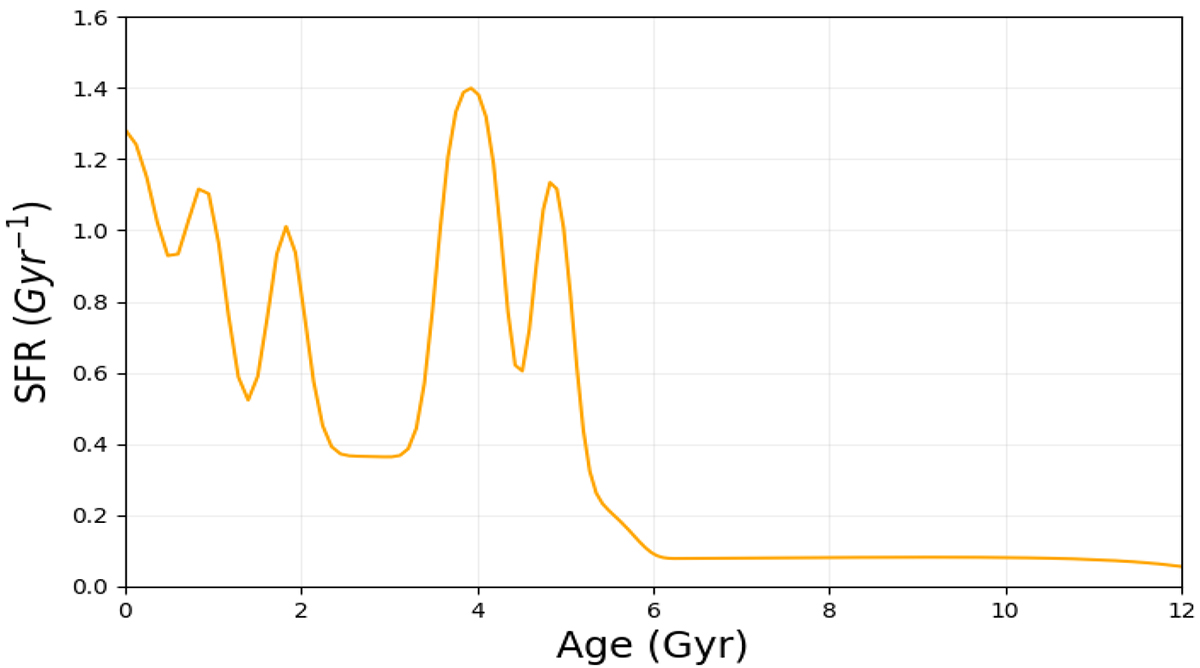
Fig. 5.
Download original image
Star formation history of the SMC derived from star clusters. The figure illustrates the SFRs corresponding to our best-fit model (green curve in Fig. 4). The prominent peaks show enhancement in SFR followed by the merger (3.5 − 6 Gyr) and then due to the LMC-SMC interactions (< 3 Gyr). A Gaussian smoothing with a sigma value of 1.8 Gyr was applied to the model to approximate the broadening of the observed peaks and provide a reasonable visual match.
Current usage metrics show cumulative count of Article Views (full-text article views including HTML views, PDF and ePub downloads, according to the available data) and Abstracts Views on Vision4Press platform.
Data correspond to usage on the plateform after 2015. The current usage metrics is available 48-96 hours after online publication and is updated daily on week days.
Initial download of the metrics may take a while.