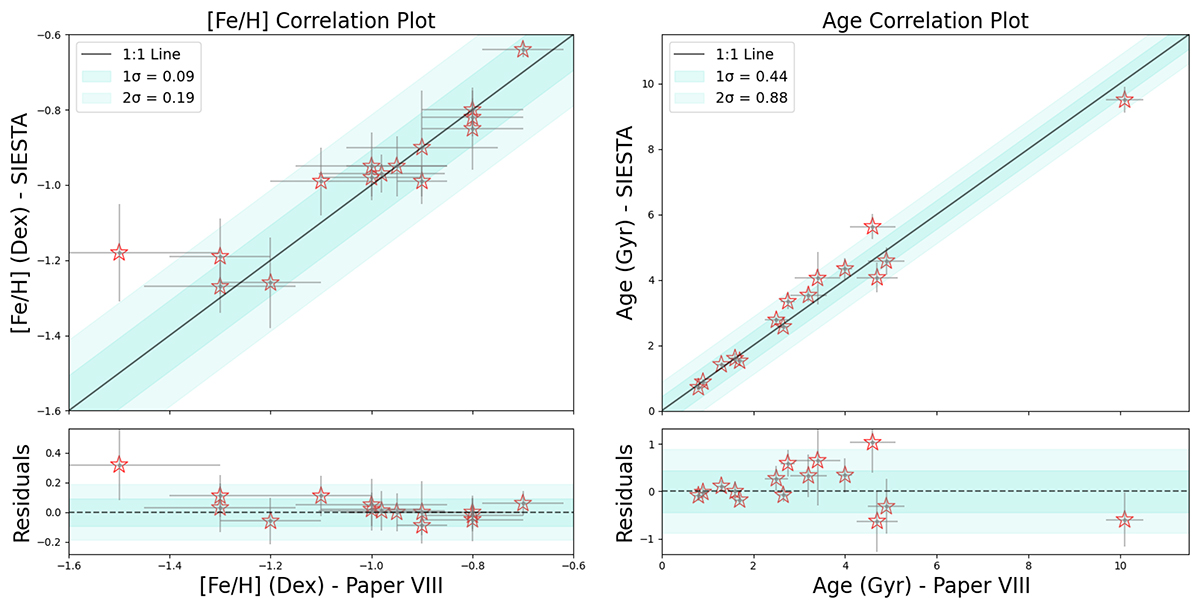
Fig. B.1.
Download original image
Correlation plots between the metallicities (left) and ages (right) derived using the SIESTA code compared to the values from previous VISCACHA papers, where the ages and metallicities were derived by visually fitting isochrones to the VISCACHA CMDs (Paper VIII). The corresponding residual plots are displayed beneath each main plot. 1 and 2 sigma regions are shaded to provide a visual representation of the deviations in the correlation plot.
Current usage metrics show cumulative count of Article Views (full-text article views including HTML views, PDF and ePub downloads, according to the available data) and Abstracts Views on Vision4Press platform.
Data correspond to usage on the plateform after 2015. The current usage metrics is available 48-96 hours after online publication and is updated daily on week days.
Initial download of the metrics may take a while.