Fig. 12.
Download original image
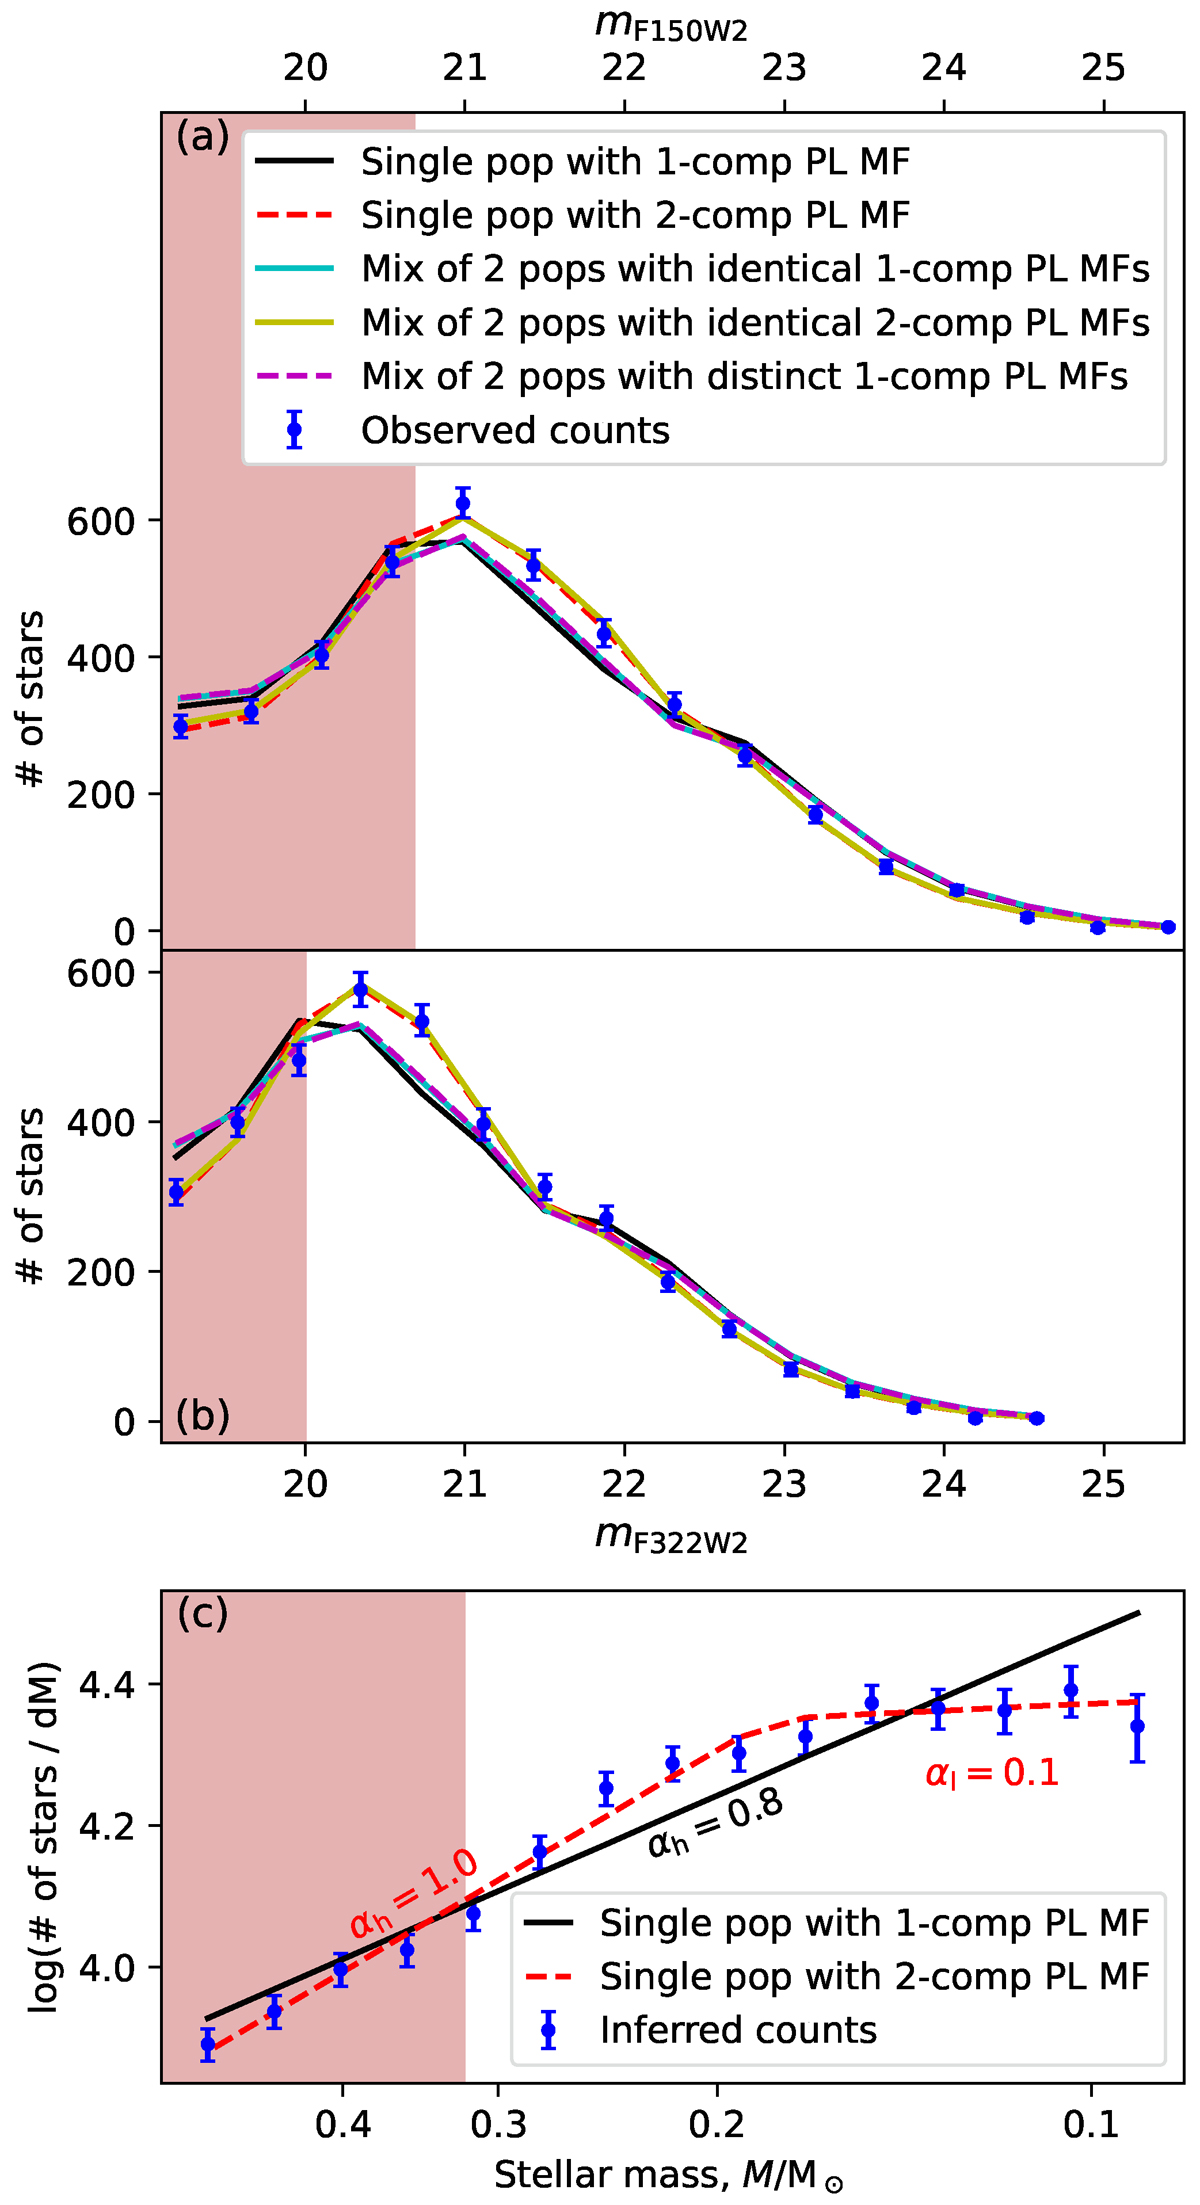
Observed LFs and derived MF of ω Cen. Panels (a) and (b) show the observed LFs of ω Cen in F150W2 and F322W2 bands, respectively. The LFs are represented as histograms with 15 uniform bins. Over-plotted in both panels are the best-fitting LF models (taken to be the model with the smallest GoF in F150W2) from each of the five families listed in Table 1. The model curves include completeness effects. Panel (c) shows the MF of the cluster based on the inferred stellar masses from the observed F150W2 magnitudes and the Y = 0.25 NOM isochrone, shown in panel (b) of Fig. 6. Unlike panels (a) and (b), the inferred counts in panel (c) have been corrected for photometric completeness. Over-plotted are the best-fitting single-component and two-component power-law MFs. In the legends, pop stands for population, comp for component, and PL for power law. The light red areas qualitatively mark magnitude ranges where MS stars are mildly saturated in at least one filter. The LF and MF values in these regions should be interpreted with caution.
Current usage metrics show cumulative count of Article Views (full-text article views including HTML views, PDF and ePub downloads, according to the available data) and Abstracts Views on Vision4Press platform.
Data correspond to usage on the plateform after 2015. The current usage metrics is available 48-96 hours after online publication and is updated daily on week days.
Initial download of the metrics may take a while.