Fig. 13.
Download original image
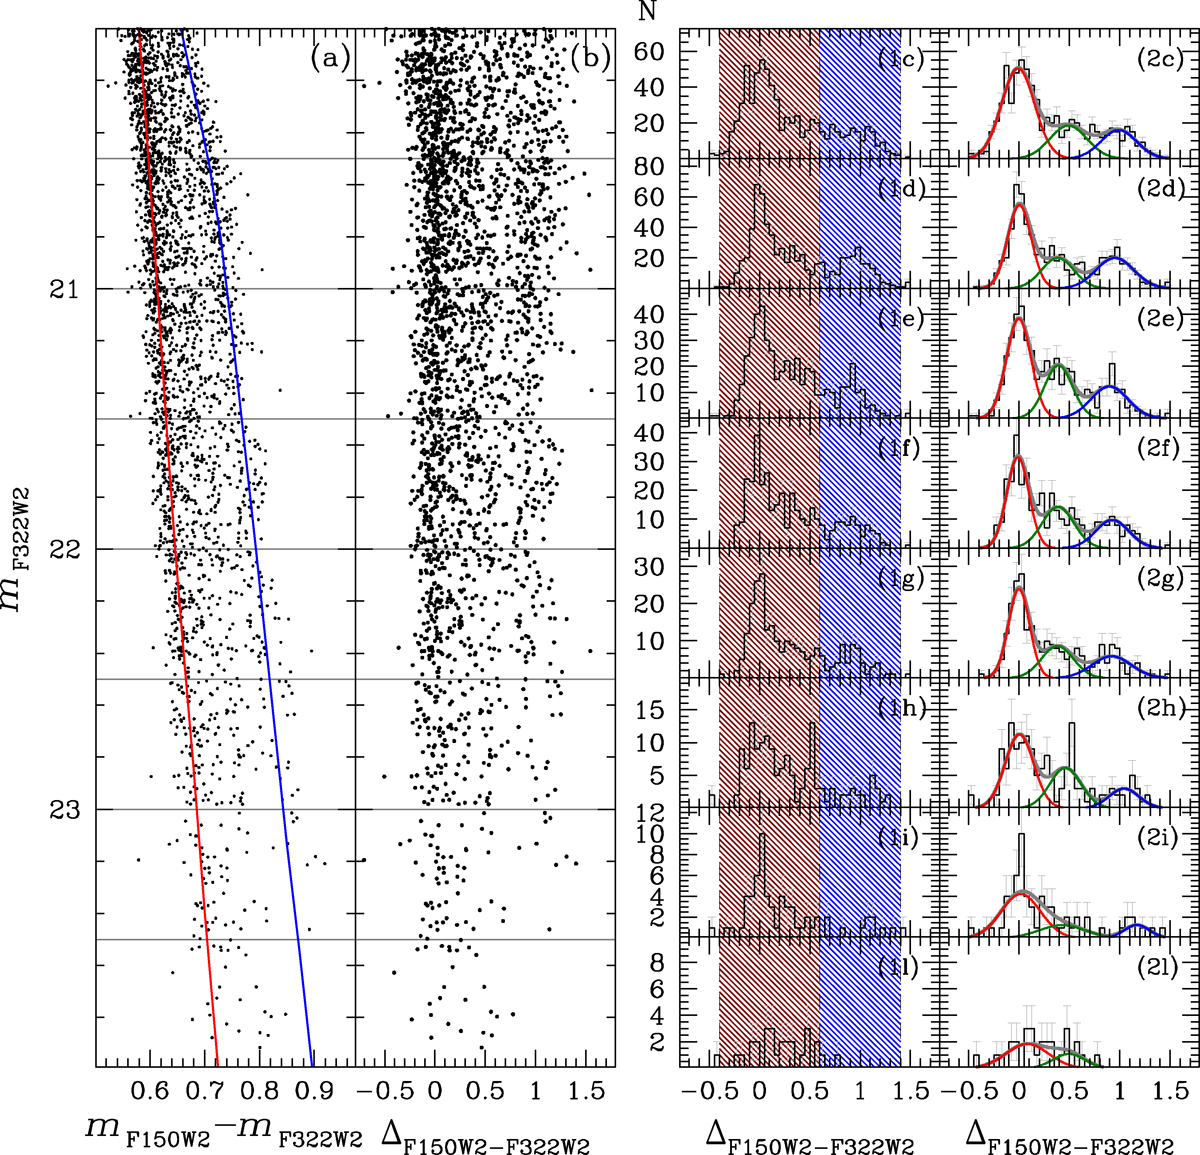
Procedure for estimating the LFs of the sequences in ω Cen in the low-MS. Panel (a) shows the mF322W2 versus mF150W2 − mF322W2 CMD, focusing on the region where the separation between the components is most evident. The red and blue lines indicate the fiducials of the rMS and bMS, respectively, and are used to construct the verticalised CMD shown in panel (b). Panels (1,2c) through (1,2l) display the histogram distribution of ΔmF150W2 − mF322W2 for stars across eight magnitude intervals, as defined by the grey lines in panels (a) and (b). In panels (1c) to (1l), the red and blue regions corresponding to the two sequences are highlighted. These regions are used to estimate the LFs presented in Fig. 14, with values reported in Table 2. Panels (2c) to (2l) present the same histograms with the best-fitting multi-Gaussian models overlaid: three-Gaussian fits in panels (2c) to (2i) and a two-Gaussian fit in panel (2l). The individual Gaussian components are shown in red, green, and blue, while the combined fit is plotted in grey. The obtained LFs are shown in Fig. 15 and the values are reported in Table 3.
Current usage metrics show cumulative count of Article Views (full-text article views including HTML views, PDF and ePub downloads, according to the available data) and Abstracts Views on Vision4Press platform.
Data correspond to usage on the plateform after 2015. The current usage metrics is available 48-96 hours after online publication and is updated daily on week days.
Initial download of the metrics may take a while.