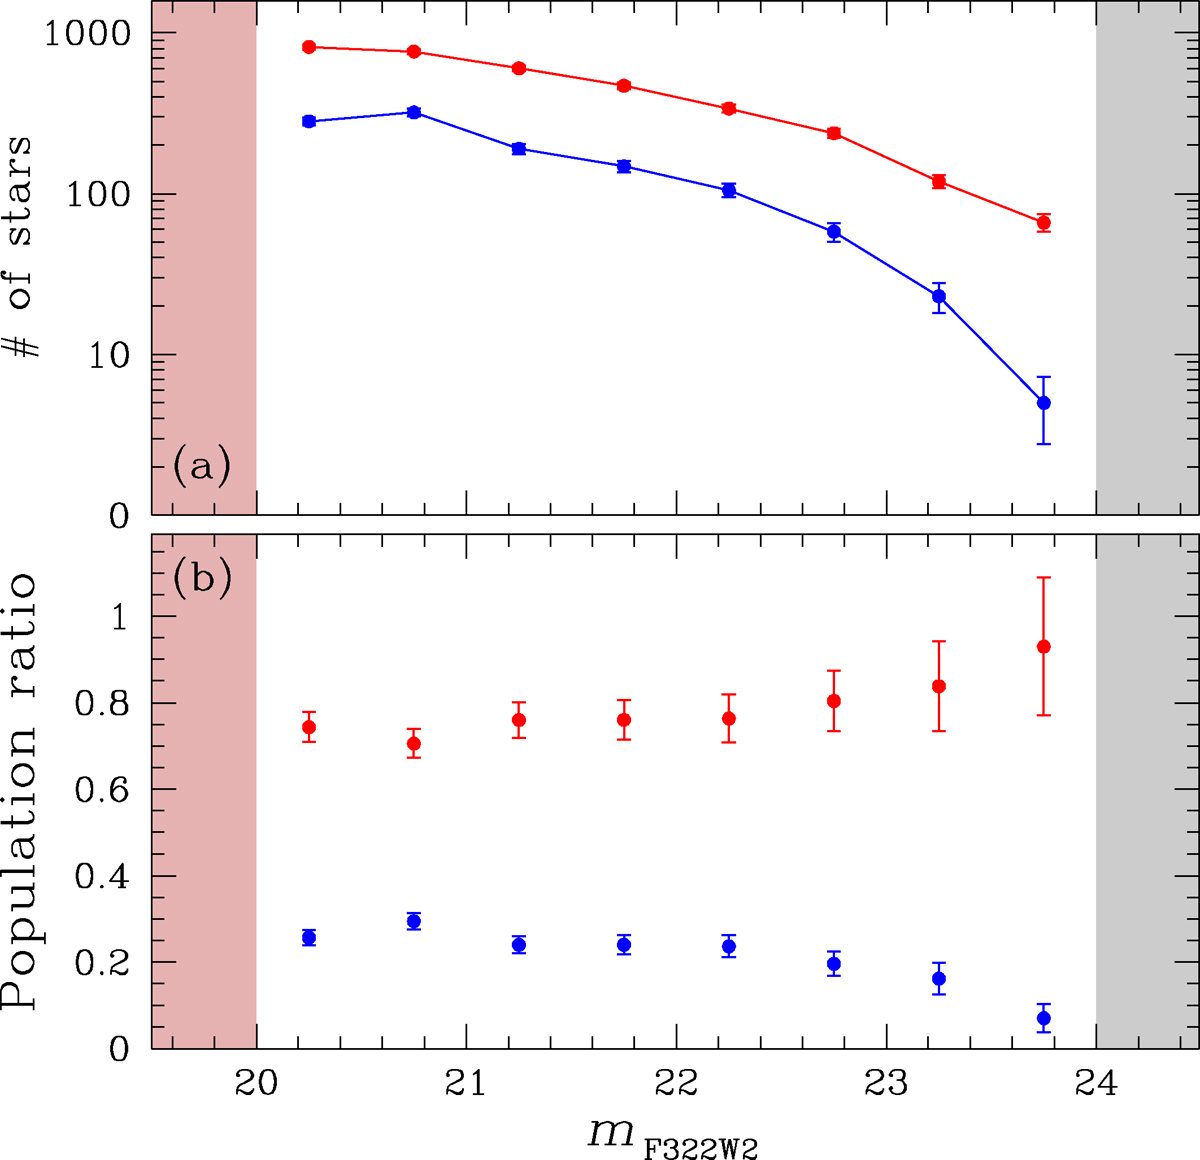
Fig. 14.
Download original image
(a) LF derived using the regions defined in panels (1c) to (1l) of Fig. 13. (b) Population ratio of stars associated with the two sequences. In both panels, the red-shaded region indicates the saturation limit, while the grey-shaded region marks the threshold beyond which the three populations can no longer be distinguished.
Current usage metrics show cumulative count of Article Views (full-text article views including HTML views, PDF and ePub downloads, according to the available data) and Abstracts Views on Vision4Press platform.
Data correspond to usage on the plateform after 2015. The current usage metrics is available 48-96 hours after online publication and is updated daily on week days.
Initial download of the metrics may take a while.