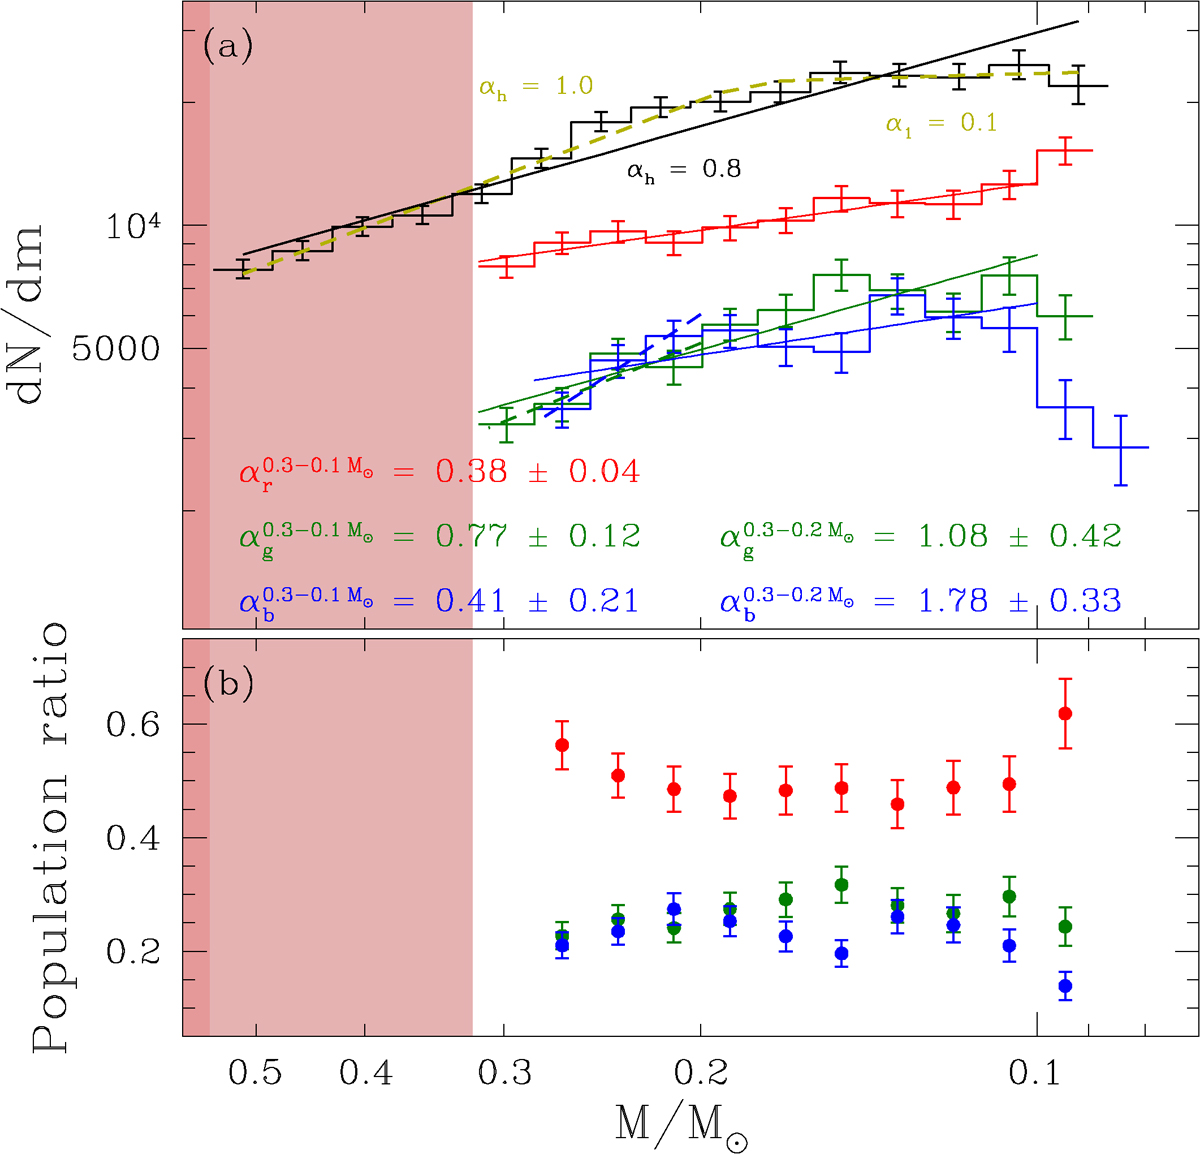
Fig. 16.
Download original image
(a) MFs of the three identified sequences, along with interpolating lines in the mass range 0.1 < M < 0.3 M⊙ (solid lines). The corresponding power-law slopes are indicated in the plot. For the gMS and bMS, we also show fits in the narrower mass range 0.2 < M < 0.3 M⊙ (dashed lines), with their respective slopes also reported. The black histogram represents the combined MF, as shown in panel (c) of Fig. 12. The solid black line and dashed yellow line correspond to the single-component and broken (two-component) power-law fits to the combined MF, respectively, with their slopes provided for reference. (b) Population ratio of stars associated with the three sequences as a function of stellar mass. The shaded light red and dark red regions highlight areas affected by mild and severe saturation, respectively.
Current usage metrics show cumulative count of Article Views (full-text article views including HTML views, PDF and ePub downloads, according to the available data) and Abstracts Views on Vision4Press platform.
Data correspond to usage on the plateform after 2015. The current usage metrics is available 48-96 hours after online publication and is updated daily on week days.
Initial download of the metrics may take a while.