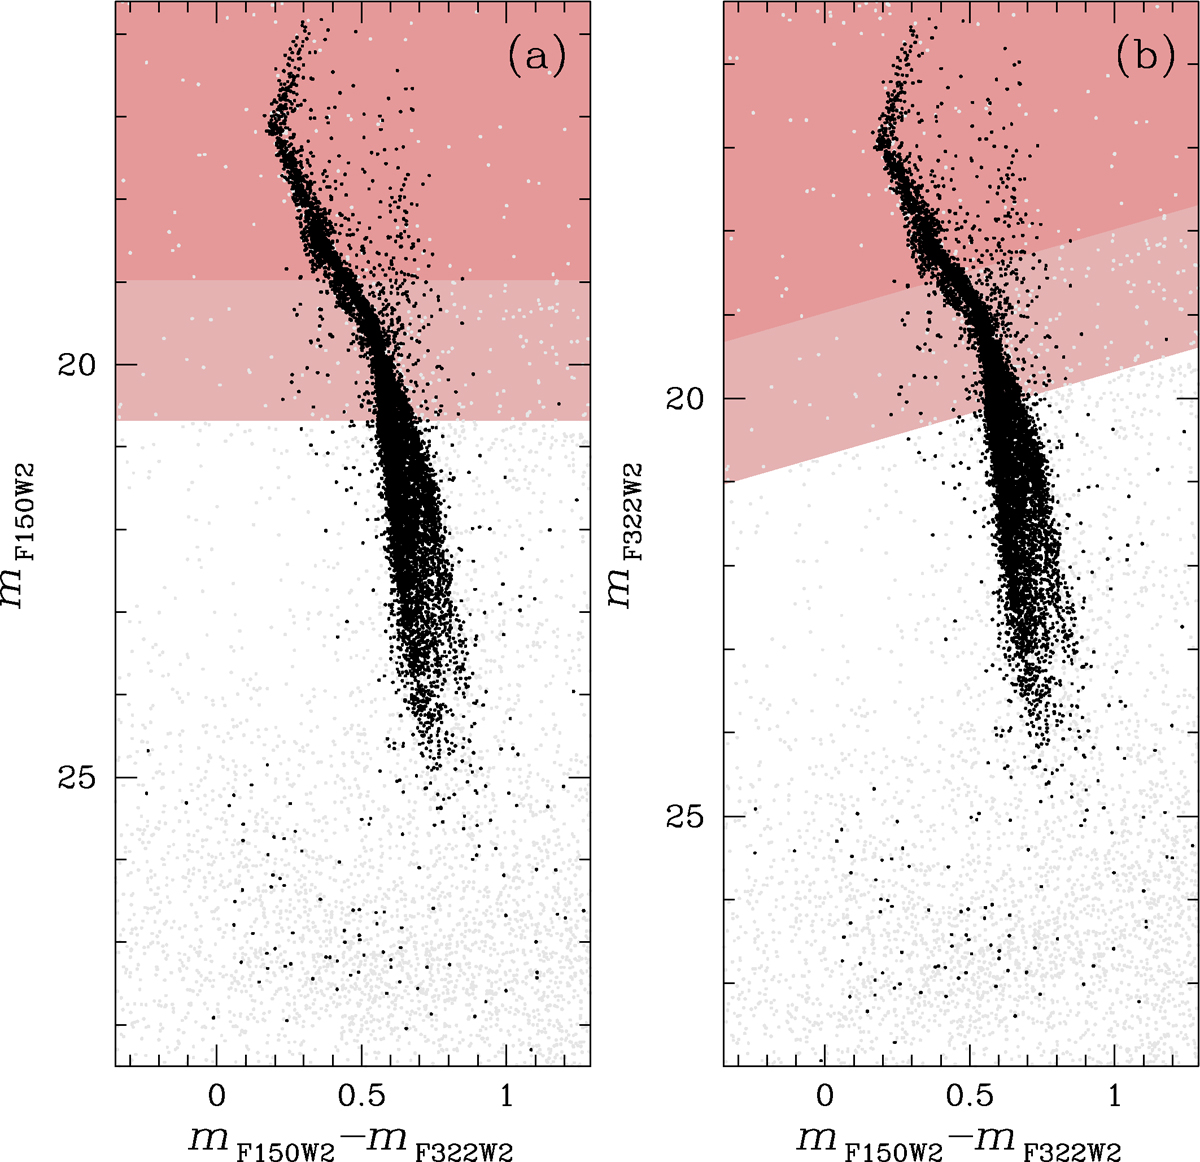
Fig. 2.
Download original image
Colour-magnitude diagrams of ω Cen using JWST filters. (a) mF150W2 versus mF150W2 − mF322W2 CMD. (b) mF322W2 versus mF150W2 − mF322W2 CMD. In both panels, black dots represent stars passing the quality selections while grey dots represent stars not passing the selections. The shaded light red and dark red regions highlight areas of the CMDs affected by saturation. The light red region corresponds to saturated photometry, while the dark red region represents severe saturation, where the photometry is saturated even in the frame zero.
Current usage metrics show cumulative count of Article Views (full-text article views including HTML views, PDF and ePub downloads, according to the available data) and Abstracts Views on Vision4Press platform.
Data correspond to usage on the plateform after 2015. The current usage metrics is available 48-96 hours after online publication and is updated daily on week days.
Initial download of the metrics may take a while.