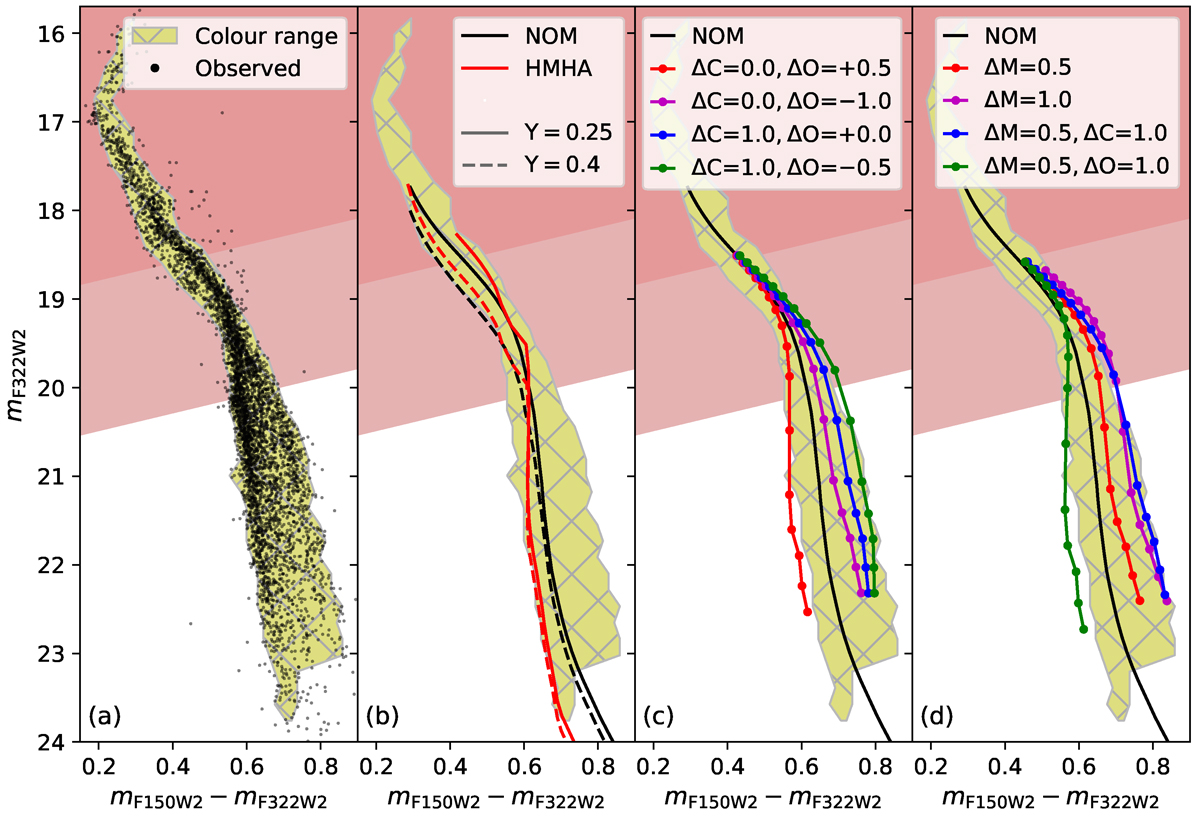
Fig. 6.
Download original image
Comparison between the JWST NIR CMD of ω Cen presented in this study, and model isochrones. For clarity, we do not plot isochrones on the observed CMD directly. Instead, we compare the isochrones to the region of the colour-magnitude space occupied by the cluster, which is shaded in yellow in all panels. Panel (a) demonstrates how this region was chosen in relation to the observed CMD. Panel (b) over-plots two of the isochrones from Gerasimov et al. (2022) with both their original helium mass fraction (Y = 0.4, dashed lines) and with modified evolutionary models that incorporate a near-solar helium abundance (Y = 0.25, solid lines). Panels (c) and (d) show the Y = 0.25 NOM isochrone as well as its lower-MS variations with various chemical offsets. In the legend, ΔC, ΔO and ΔM refers to the offsets in [C/H], [O/H] and [M/H] from the chemical composition adopted for NOM in Gerasimov et al. (2022), where M only refers to metals heavier than oxygen. The shaded light red and dark red regions highlight areas of the CMDs affected by mild and severe saturation, respectively.
Current usage metrics show cumulative count of Article Views (full-text article views including HTML views, PDF and ePub downloads, according to the available data) and Abstracts Views on Vision4Press platform.
Data correspond to usage on the plateform after 2015. The current usage metrics is available 48-96 hours after online publication and is updated daily on week days.
Initial download of the metrics may take a while.