Open Access
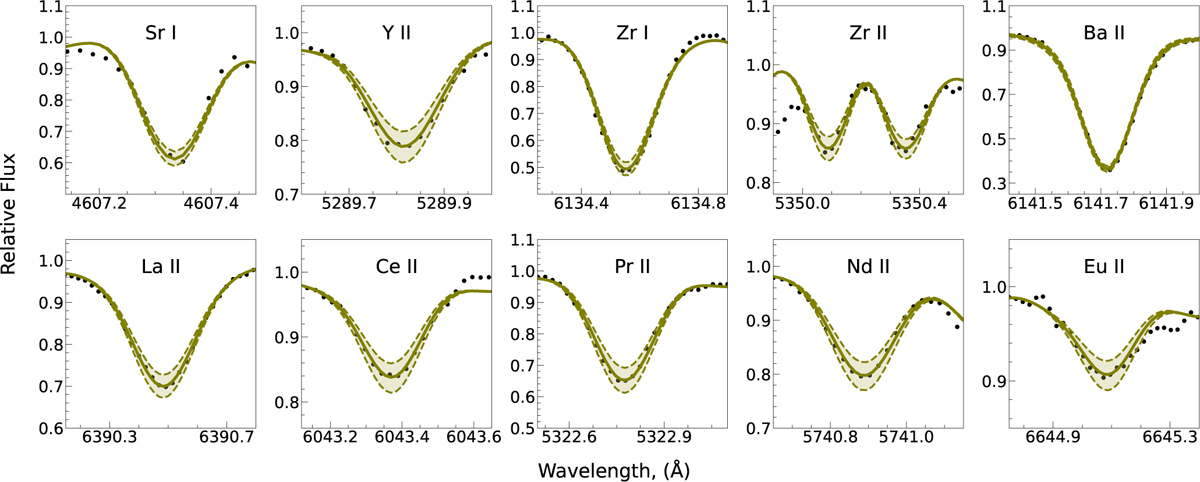
Fig. 2
Download original image
Examples of synthetic spectrum fits for neutron-capture elements in our stars with planets. The observed spectra (black dots) are compared with the best-fit synthetic spectra (solid olive lines) to determine elemental abundances. Dashed lines represent the variations of ±0.10 dex from the optimally fitted abundance.
Current usage metrics show cumulative count of Article Views (full-text article views including HTML views, PDF and ePub downloads, according to the available data) and Abstracts Views on Vision4Press platform.
Data correspond to usage on the plateform after 2015. The current usage metrics is available 48-96 hours after online publication and is updated daily on week days.
Initial download of the metrics may take a while.