Fig. A.1
Download original image
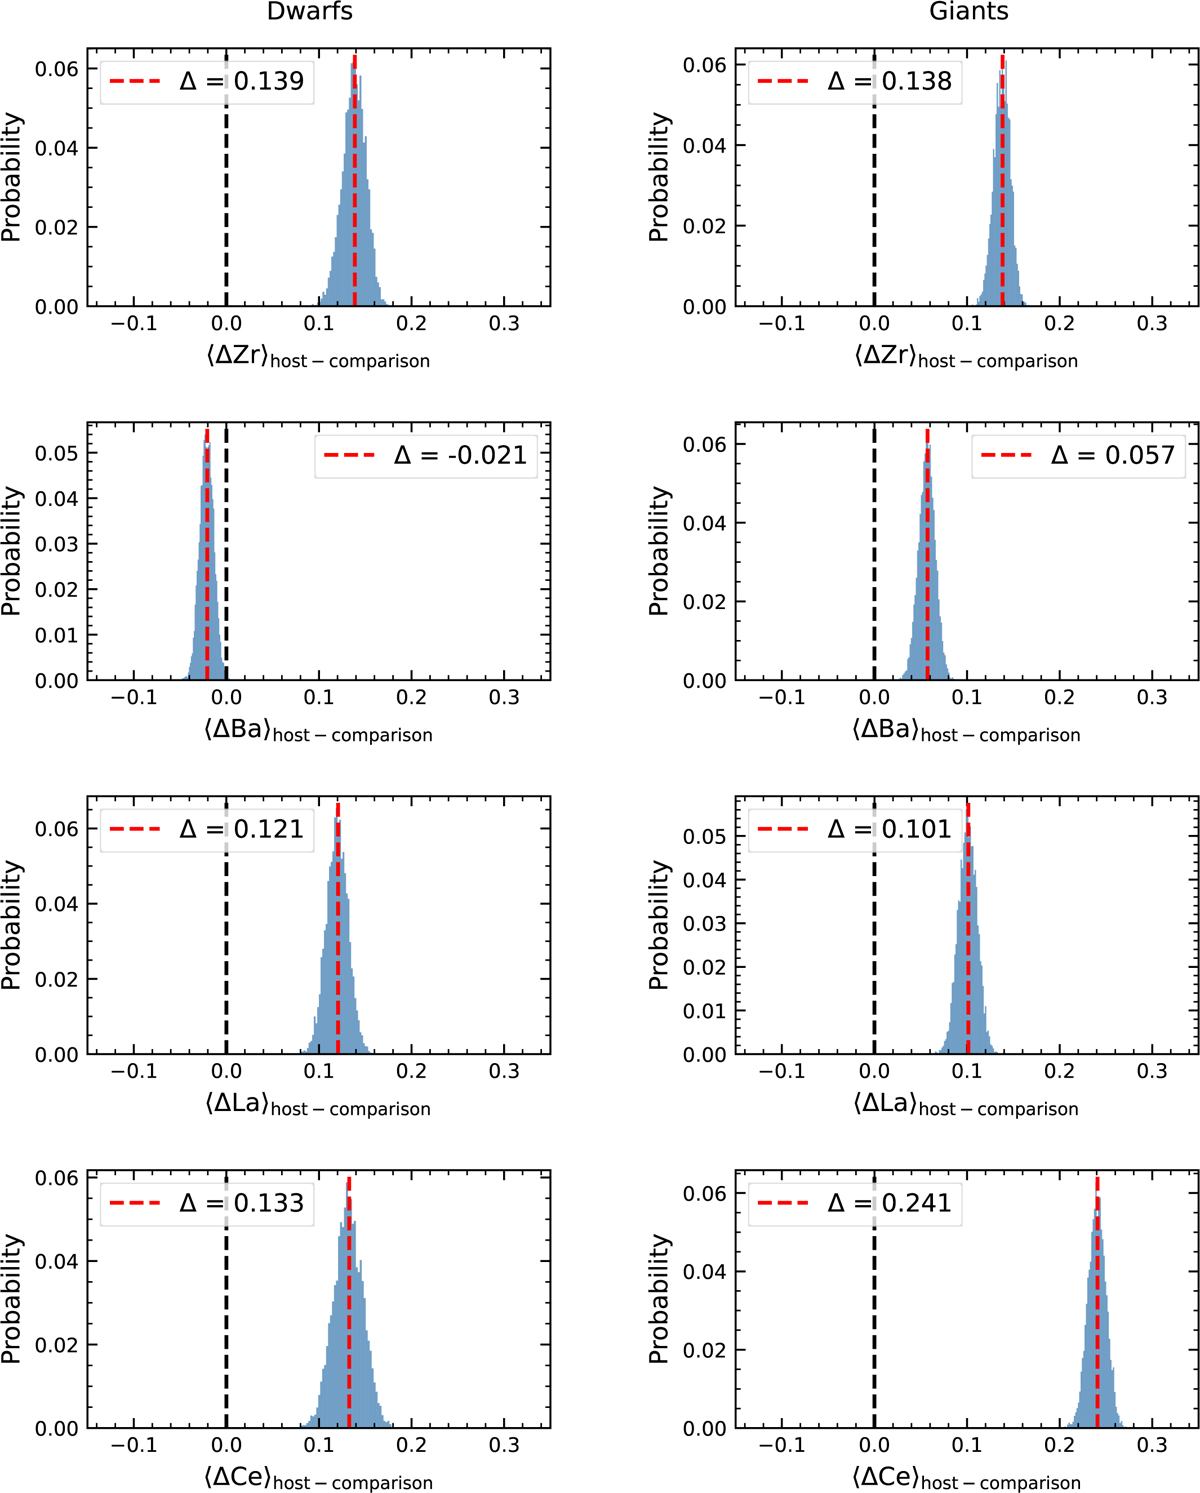
Bootstrap distributions of mean abundance differences (Δ = [El/Fe]host − [El/Fe]compalison) for selected n-capture elements (Zr, Ba, La, and Ce) in dwarfs and giants. Each histogram represents the result of 10 000 resampled comparisons with a control sample matched in Teff, log ɡ, nd [Fe/H], The vertical dashed lines mark Δ = 0 (black) and the calculated mean Δ (red).
Current usage metrics show cumulative count of Article Views (full-text article views including HTML views, PDF and ePub downloads, according to the available data) and Abstracts Views on Vision4Press platform.
Data correspond to usage on the plateform after 2015. The current usage metrics is available 48-96 hours after online publication and is updated daily on week days.
Initial download of the metrics may take a while.