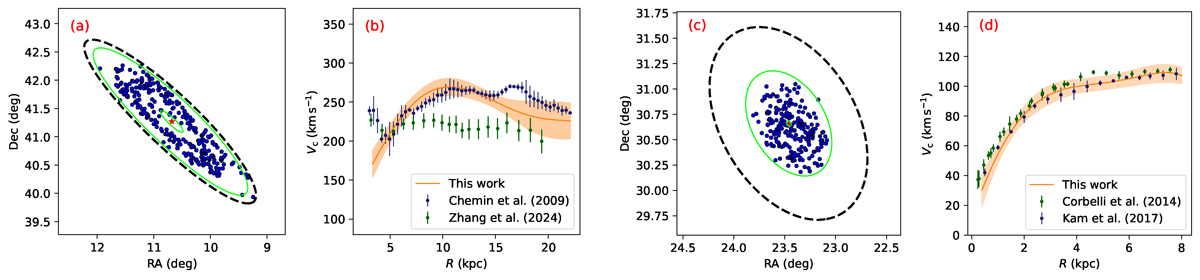
Fig. 1.
Download original image
Panel (a): Spatial distribution of 321 supergiant candidates for modeling the RC of M31 disk region. The red star denotes the COM of M31, and the dashed black outer line represents the 1.8° ellipse of the projected disk. Inner and outer green ellipses denote the reliable range of our derived RC. Panel (b): RC of the M31 disk region. The orange line and the shaded area represent the best fit and the corresponding standard error from this work, while the blue and green error-bars represent results from previous studies, as labeled in the bottomright corner. Panel (c): Spatial distribution of 235 supergiant candidates for modeling the RC of M33 disk region. The red star denotes the COM of M33, and the dashed black outer line represents the 1° ellipse of the projected disk. Inner and outer green ellipses denote the reliable range of our derived RC. Panel (d): RC of the disk of M33. The orange line and the shaded area illustrate the best fit and its corresponding standard error from this work. The blue and green error-bars represent results obtained from previous studies by H I observations, as labeled in the bottomright corner.
Current usage metrics show cumulative count of Article Views (full-text article views including HTML views, PDF and ePub downloads, according to the available data) and Abstracts Views on Vision4Press platform.
Data correspond to usage on the plateform after 2015. The current usage metrics is available 48-96 hours after online publication and is updated daily on week days.
Initial download of the metrics may take a while.