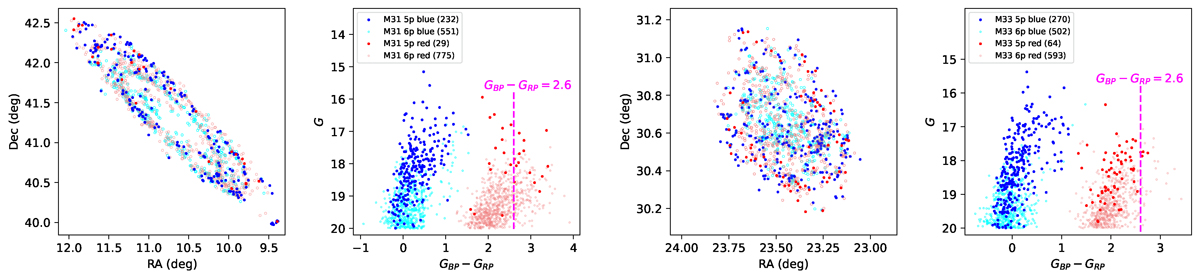
Fig. 2.
Download original image
Spatial and CMD distributions of final M31 and M33 supergiant samples (see Sect. 3.1). The left-hand panels display the spatial and CMD distributions of the M31 sample stars, while the right-hand panels present those of the M33 sample stars. Filled blue and red symbols denote blue (including some yellow) and red supergiants with a 5p astrometric solution, respectively; open cyan and pink circles indicate blue and red supergiants with a 6p solution. The dashed magenta line in the CMD panels marks GBP − GRP = 2.6. Clearly, M31 contains a significantly larger population of extremely red supergiant stars compared to M33.
Current usage metrics show cumulative count of Article Views (full-text article views including HTML views, PDF and ePub downloads, according to the available data) and Abstracts Views on Vision4Press platform.
Data correspond to usage on the plateform after 2015. The current usage metrics is available 48-96 hours after online publication and is updated daily on week days.
Initial download of the metrics may take a while.