Fig. 3.
Download original image
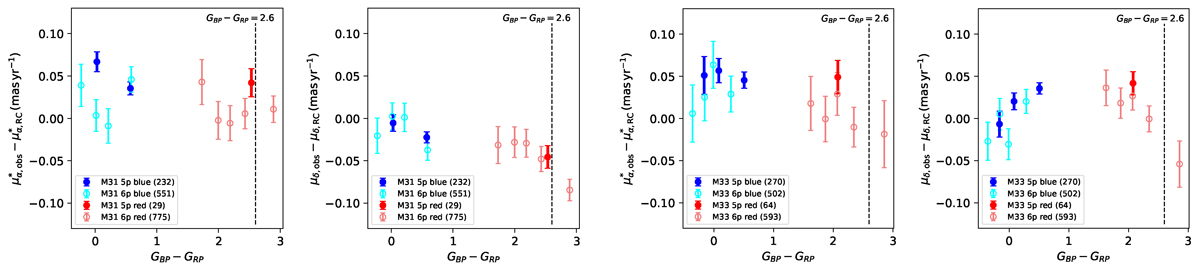
Left-hand panels: PM distribution of the blue and red M31 samples as a function of GBP − GRP. The data points in the left (right) panel show the weighted average differences between the observed PMs, ![]() (μδ, obs), from Gaia DR3 and the predicted rotational components
(μδ, obs), from Gaia DR3 and the predicted rotational components ![]() (
(![]() ), derived from the RC in Sect. 3.1.1. Weights are proportional to 1/σα*2 or 1/σδ2, and the errors, also weighted by uncertainty, are indicated accordingly. Right-hand panels: Similar to the left-hand panels, but for M33.
), derived from the RC in Sect. 3.1.1. Weights are proportional to 1/σα*2 or 1/σδ2, and the errors, also weighted by uncertainty, are indicated accordingly. Right-hand panels: Similar to the left-hand panels, but for M33.
Current usage metrics show cumulative count of Article Views (full-text article views including HTML views, PDF and ePub downloads, according to the available data) and Abstracts Views on Vision4Press platform.
Data correspond to usage on the plateform after 2015. The current usage metrics is available 48-96 hours after online publication and is updated daily on week days.
Initial download of the metrics may take a while.