Fig. 6.
Download original image
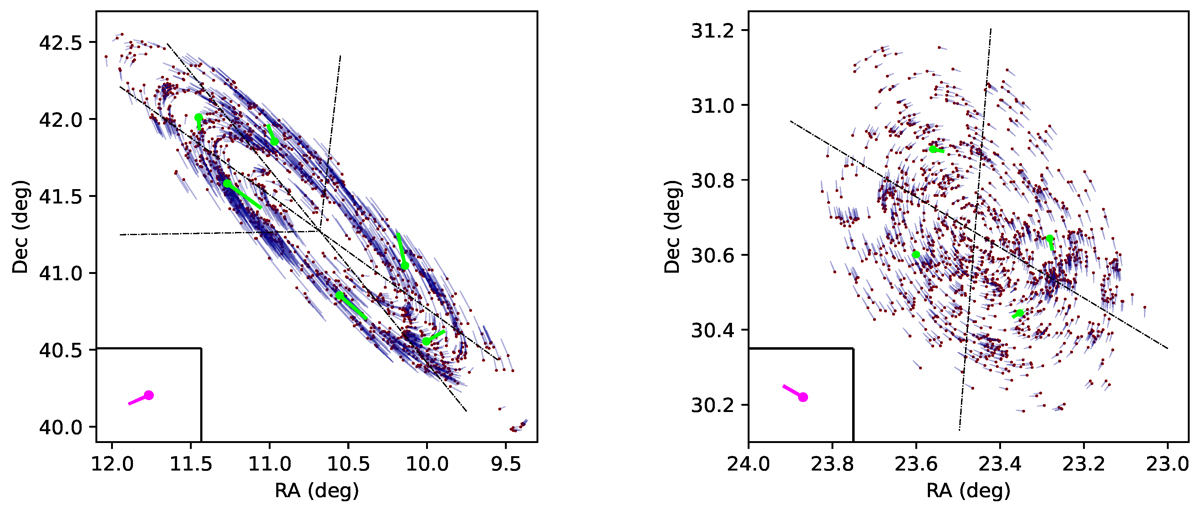
PM kinematics of M31 (left) and M33 (right). All 5p and 6p sample stars with GBP − GRP ≤ 2.6 are marked as red dots. The blue segments represent their predicted PMs from disk rotation, as determined in Sects. 3.1.1 and 3.1.2, without considering the systemic PM component. The derived M31 and M33 COM PMs (after zero-point correction) using the 5p sample in the heliocentric frame are shown as the magenta segments at the bottomleft corner of each panel. Green segments illustrate the average observed PMs in six (four) position angle bins for M31 (M33), after zero-point correction and subtraction of the COM PM. Each bin contains more than 210 (300) sources for M31 (M33), with bin boundaries indicated by dashed black lines. In each case, the PM direction starts at the dot and points along the line segment.
Current usage metrics show cumulative count of Article Views (full-text article views including HTML views, PDF and ePub downloads, according to the available data) and Abstracts Views on Vision4Press platform.
Data correspond to usage on the plateform after 2015. The current usage metrics is available 48-96 hours after online publication and is updated daily on week days.
Initial download of the metrics may take a while.