Fig. 1
Download original image
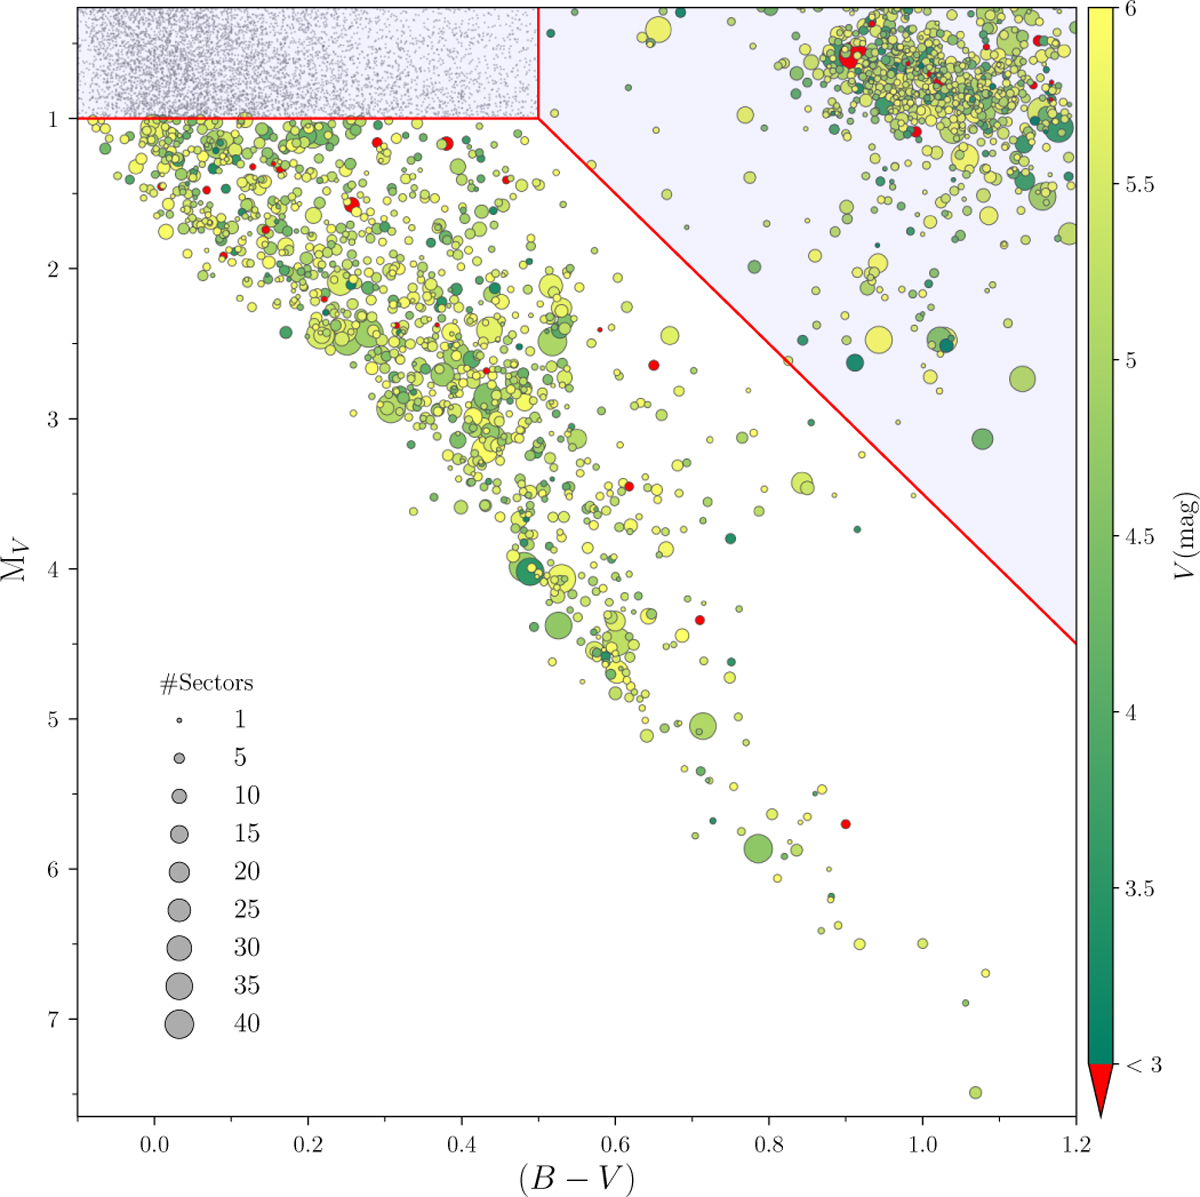
HR-diagram showing the criteria for our selection of targets. The red line shows our limits on MV and (B − V), and targets in the lower non-shaded region were selected for analysis. The marker colour indicates the V-band magnitude for the stars, while the marker size indicates the number of sectors TESS will have observed a given star in Cycle 6 (up to and including Sector 83). The stars in the top left shaded box are not expected to show solar-like oscillations and here we have not indicated V nor the number of sectors. The stars in the top-right shaded region contain evolved stars that may well show solar-like oscillations – these will be the subject of a future study.
Current usage metrics show cumulative count of Article Views (full-text article views including HTML views, PDF and ePub downloads, according to the available data) and Abstracts Views on Vision4Press platform.
Data correspond to usage on the plateform after 2015. The current usage metrics is available 48-96 hours after online publication and is updated daily on week days.
Initial download of the metrics may take a while.