Fig. C.1
Download original image
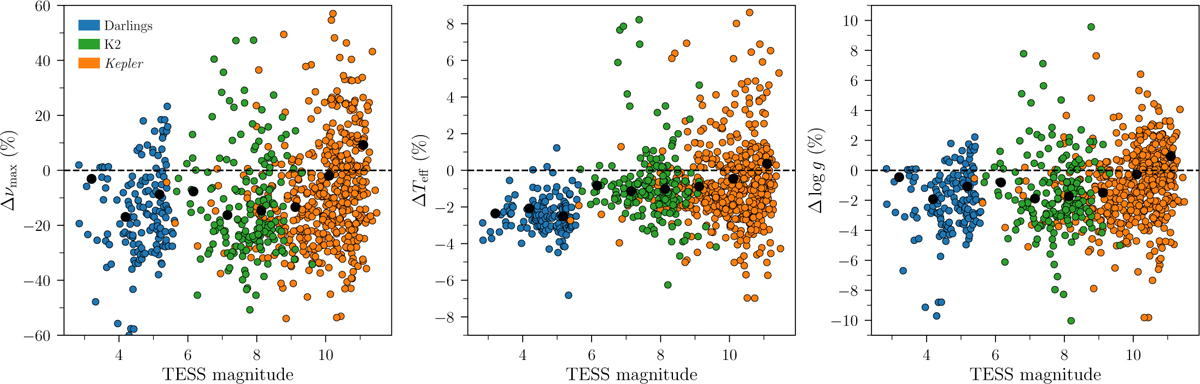
Comparison between ATL3 input/output and measured values for the TLS and literature values for the K2 (Lund et al. 2016, 2024) and Kepler (Lund et al. 2017; Mathur et al. 2022; Serenelli et al. 2017) samples. Left: Relative difference (measured-predicted) between measured and predicted values of νmax from ATL3 with its standard priority of inputs on Teff and log g (primarily from Gaia DR3’s gspphot) against TESS magnitude. Middle (Right): Relative difference on Teff (log g) for the three samples. For the K2 and Kepler samples, the measured values are obtained from the literature and adopted from Casagrande et al. (2011) for the TLS. The black markers indicate median binned values of the combined samples.
Current usage metrics show cumulative count of Article Views (full-text article views including HTML views, PDF and ePub downloads, according to the available data) and Abstracts Views on Vision4Press platform.
Data correspond to usage on the plateform after 2015. The current usage metrics is available 48-96 hours after online publication and is updated daily on week days.
Initial download of the metrics may take a while.