Fig. 2
Download original image
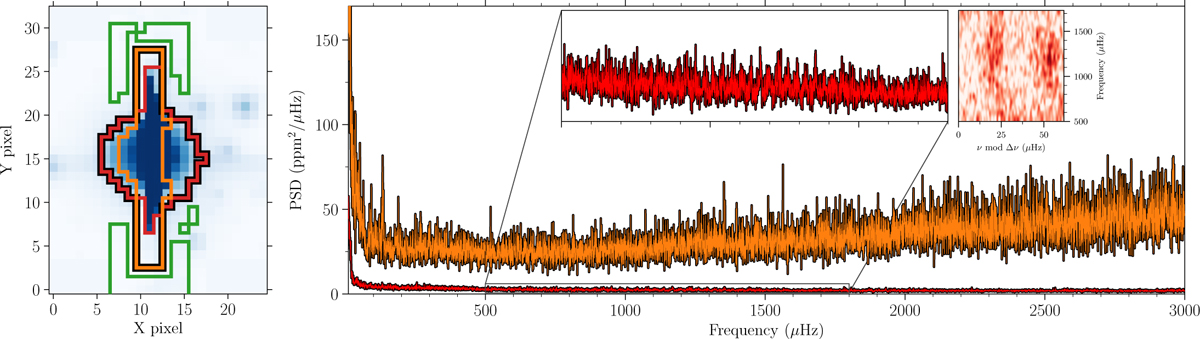
Example of the effect of adopting custom apertures, here for ψ1 Dra A (TIC 441804568) as observed during Sector 15 in 120-s cadence, where the SPOC aperture is missing several high-flux pixels. Similar apertures are seen for ψ1 Dra A in other sectors. Left: adopted aperture, shown with a black outline, combining the SPOC aperture, in orange, and the K2P2 aperture, in red. The green outline shows the aperture used to estimate the background. In blue, the median pixel flux levels are shown on a log-scale. Right: segments of the power-density spectra of the filtered SAP light curves from the apertures on the left, where the PSD obtained from the SPOC aperture is shown in orange and the one from the adopted custom aperture is shown in red. The inset shows a zoom of the region with identified oscillations from the custom aperture data. The small inset to the right shows the échelle diagram of the zoomed region after correcting for the background using a robust Siegel slope estimator.
Current usage metrics show cumulative count of Article Views (full-text article views including HTML views, PDF and ePub downloads, according to the available data) and Abstracts Views on Vision4Press platform.
Data correspond to usage on the plateform after 2015. The current usage metrics is available 48-96 hours after online publication and is updated daily on week days.
Initial download of the metrics may take a while.