Fig. 4
Download original image
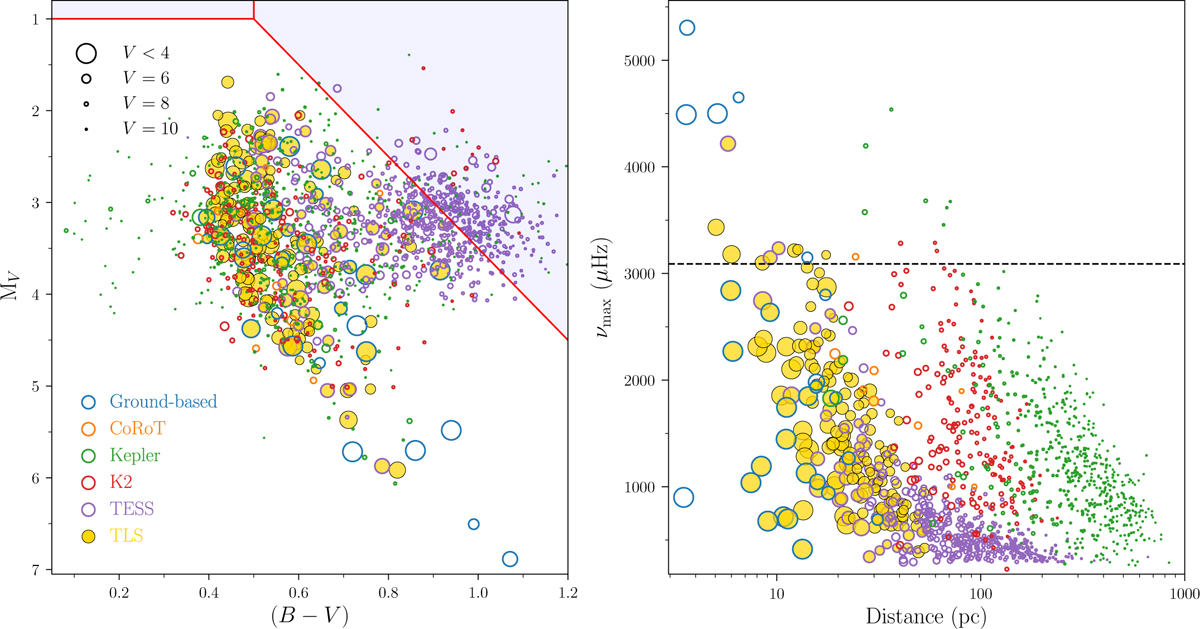
Comparison of the TLS with solar-like detections in MS/SG stars from other missions. Left: position of solar-like oscillators in the HR-diagram, with an indication of the selection criteria in MV and (B − V) used to define our sample (Sect. 2). The marker size indicates the V-band magnitude of the stars, while the marker edge colour indicates how or by which mission oscillations were first detected. Any stars with a detection of oscillations from this work are shown with a filled yellow marker. Stars with ground-based detections were identified from individual cases in the literature (see Table D.1 and Sect. 5.1); the Kepler comparison sample was constructed from the compilations of Lund et al. (2017), Serenelli et al. (2017), Mathur et al. (2022), in addition to Kepler-444 (Campante et al. 2015) and θ Cyg (Guzik et al. 2016); the nine stars from CoRoT were identified from individual cases in the literature (Barban et al. 2009, 2013; Appourchaux et al. 2008; Mosser et al. 2009; Mathur et al. 2010a, 2013; Ballot et al. 2011; Boumier et al. 2014; Castro et al. 2021); the stars forming the K2 sample are obtained from Lund et al. (2016, 2024); while the TESS sample was obtained from the catalogues of Hatt et al. (2023), Zhou et al. (2024), and Corsaro et al. (2024, considering only their confident detections; their Table 1), in addition to individual cases from the literature (see Table D.1). For the TESS and K2 comparison samples, we have limited these to stars with νmax < 284 μHz. Right: distribution of the stars in terms of distance and νmax, using only stars that in the left plot fall within the MV and (B − V) boundaries defined in our target selection. We note that α Cen A+B, at a distance of ~1.35 pc, have been omitted from the plot. Distances and magnitudes used in this plot were adopted from the TESS Input Catalog (TICv8.2; Paegert et al. 2021). The horizontal dashed line indicates the solar νmax for comparison.
Current usage metrics show cumulative count of Article Views (full-text article views including HTML views, PDF and ePub downloads, according to the available data) and Abstracts Views on Vision4Press platform.
Data correspond to usage on the plateform after 2015. The current usage metrics is available 48-96 hours after online publication and is updated daily on week days.
Initial download of the metrics may take a while.