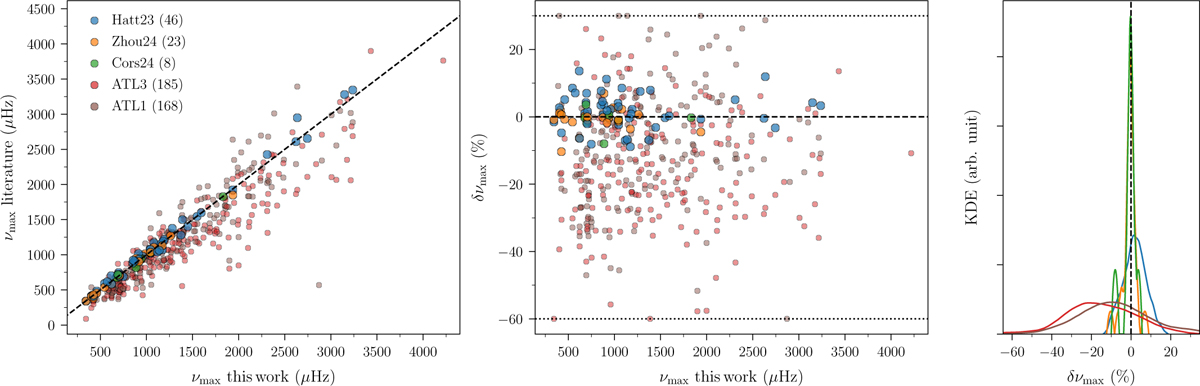
Fig. 6
Download original image
Comparison of νmax values for the stars in our sample that overlap with those of Hatt et al. (2023), Zhou et al. (2024), and Corsaro et al. (2024, considering only their confident detections; their Table 1), with the predictions from the Asteroseismic Target List (ATL) versions 1 (Schofield et al. 2019) and 3 (Hey et al. 2024). Left: direct comparison between our values and those published in the literature or predicted in the ATLs. The colour indicates the comparison source (see legend), while the numbers in the legend indicate how many stars are in common with the different comparison sources. Middle: relative differences between the values. Values beyond either +30% or −60% have been adjusted to these values (dotted lines) for a better visual rendition. Right: KDE of the relative differences.
Current usage metrics show cumulative count of Article Views (full-text article views including HTML views, PDF and ePub downloads, according to the available data) and Abstracts Views on Vision4Press platform.
Data correspond to usage on the plateform after 2015. The current usage metrics is available 48-96 hours after online publication and is updated daily on week days.
Initial download of the metrics may take a while.