Fig. 7
Download original image
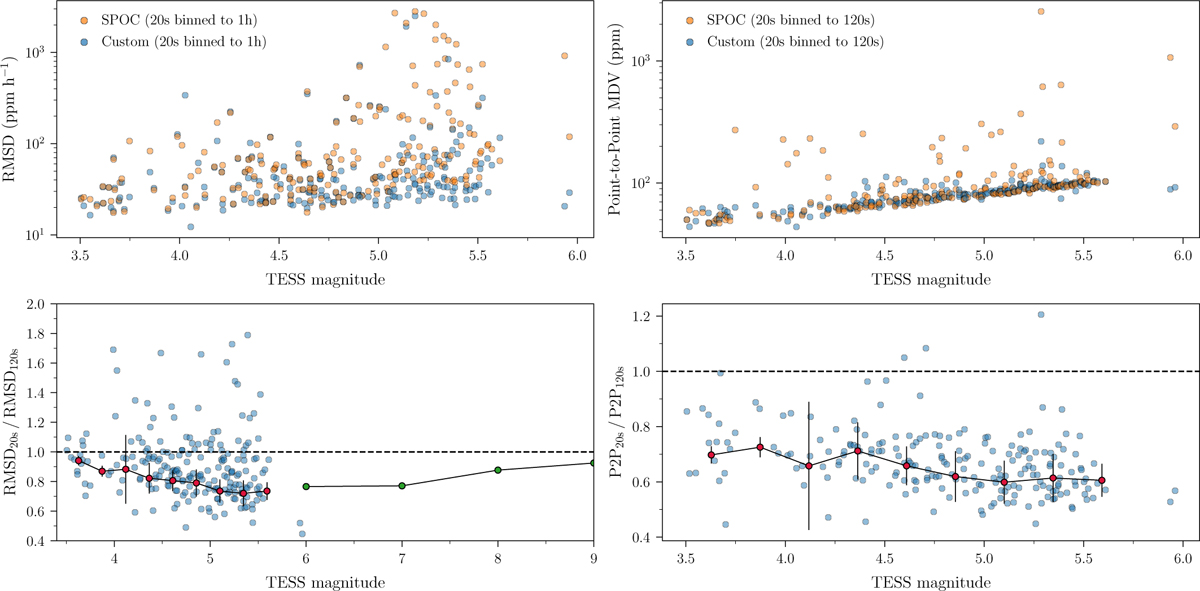
Comparison of noise statistics between different light curve sources and observing cadences, including all stars with 20-s cadence observations where a custom aperture was constructed (cf. Sect. 3). Top left: RMSD of 20-s light curve flux binned to 1 hour against TESS magnitude for both SPOC and custom aperture data. Top right: P2P-MDV of 20-s light curve flux binned to 120-s against TESS magnitude. Bottom left: ratio between the 1-hour RMSD from 20-s and 120-s cadence custom aperture data. The red markers indicate median-binned values, with uncertainties given by the standardised MAD, while the green markers give the ratios provided by Huber et al. (2022) (their Table 1). Bottom right: ratio between P2P-MDV from 20-s (binned to 120-s) and 120-s cadence custom aperture data. Red markers again indicate median-binned values, with uncertainties given by the standardised MAD.
Current usage metrics show cumulative count of Article Views (full-text article views including HTML views, PDF and ePub downloads, according to the available data) and Abstracts Views on Vision4Press platform.
Data correspond to usage on the plateform after 2015. The current usage metrics is available 48-96 hours after online publication and is updated daily on week days.
Initial download of the metrics may take a while.