Fig. 8
Download original image
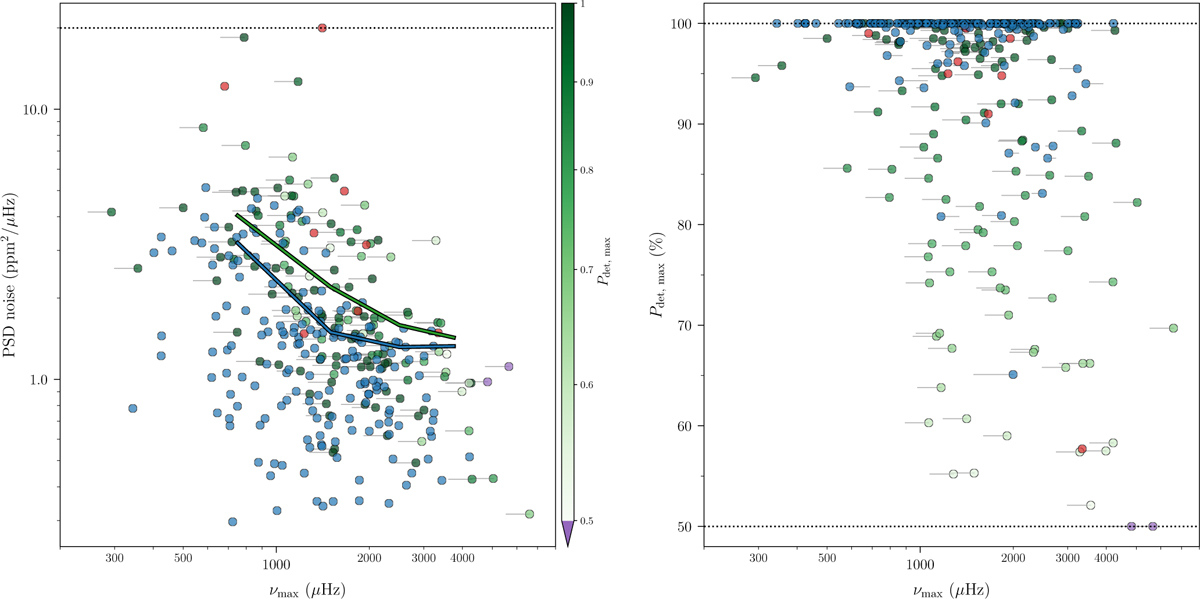
Comparison of noise levels and predicted detectability in ATL3 for stars with and without seismic detections. Left: correspondence between the global asteroseismic νmax parameters and the high-frequency PSD noise level for stars with positive seismic detections in blue, for stars identified as classical pulsators (e.g. δ Sct/γ dor), in red, and for stars without a seismic detection, in green. The νmax and colouring of the non-detection cases are given by the νmax and detection probability (Pdet) returned by the ATL3 (Hey et al. 2024), and except for a few cases, we only include stars with Pdet > 50%. The non-detection νmax values have been offset (horizontal line indicates the offset from the original position) by increasing νmax by 16%, corresponding to the apparent overall bias of the ATL3 values, as seen from Fig. 6. Stars with a noise level above 20 ppm2/μHz have been offset to this value (dotted line). The coloured lines give the median binned noise levels of stars with (blue) and without (green) detections against νmax. Right: correspondence between the maximum ATL3 Pdet (for either 20- or 120-s cadence) against νmax, with the same colouring and νmax as in the left panel. Stars with a Pdet below 50% have been offset to this value (dotted line). For the stars with seismic detection (blue), we indicate with small horizontal lines the ATL3 predicted νmax.
Current usage metrics show cumulative count of Article Views (full-text article views including HTML views, PDF and ePub downloads, according to the available data) and Abstracts Views on Vision4Press platform.
Data correspond to usage on the plateform after 2015. The current usage metrics is available 48-96 hours after online publication and is updated daily on week days.
Initial download of the metrics may take a while.