Fig. 4
Download original image
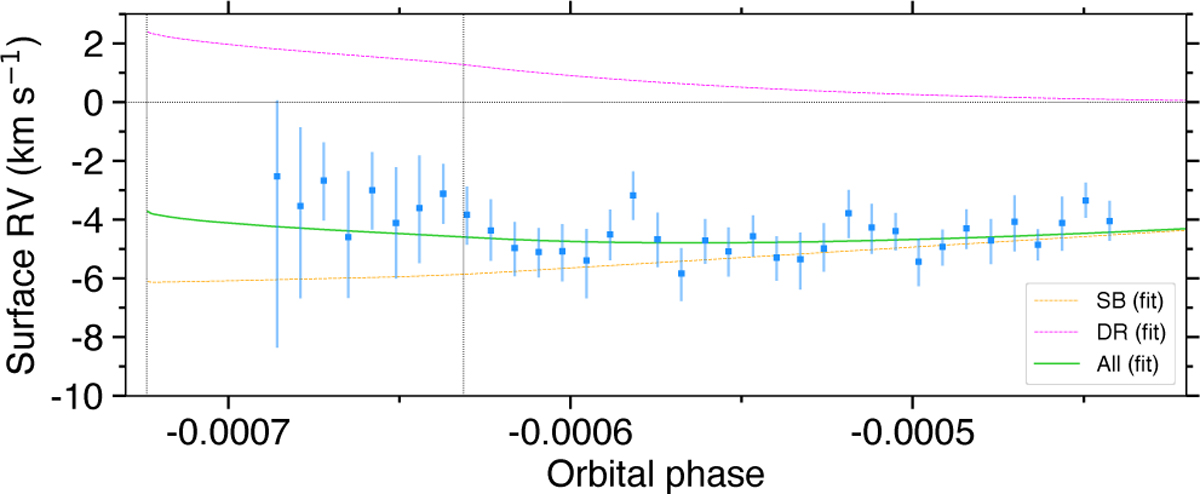
Photospheric RVs along the transit chord during ingress. The vertical dashed lines indicate ingress contacts. The blue points show the RV centroids derived from fits to individual CCFs. The green curve shows the best-fit model including differential rotation (DR), whose deviation with respect to solid-body (SB) rotation (orange curve) is plotted in magenta.
Current usage metrics show cumulative count of Article Views (full-text article views including HTML views, PDF and ePub downloads, according to the available data) and Abstracts Views on Vision4Press platform.
Data correspond to usage on the plateform after 2015. The current usage metrics is available 48-96 hours after online publication and is updated daily on week days.
Initial download of the metrics may take a while.