Fig. 1
Download original image
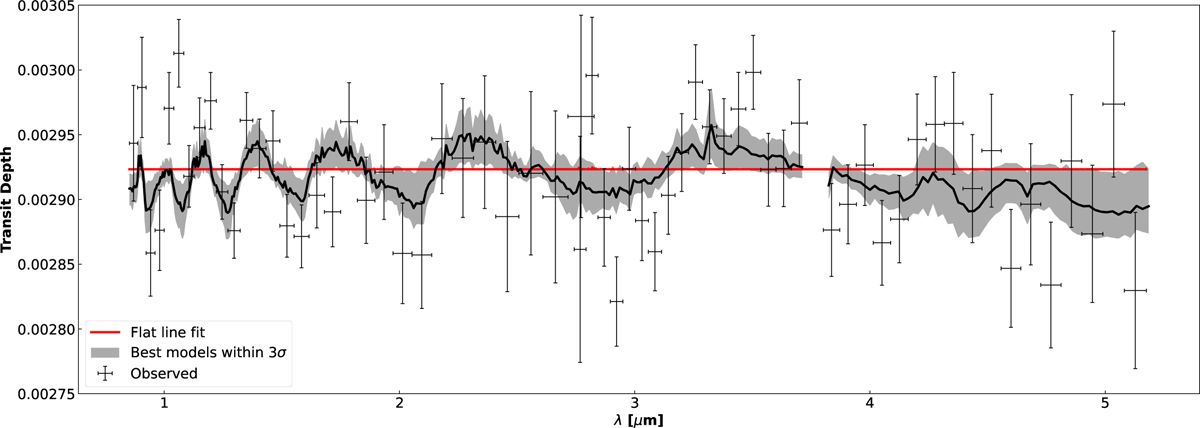
Transit spectra of non-equilibrium 1D models at resolution 200, compared to K2-18 b observation (Madhusudhan et al. 2023) low-resolution representation with an offset of −41 ppm between NIRISS and NIRSpec data. The solid gray line is the median value of the 3σ dispersion from the best fit represented with the shaded area. The red line is the best flat line retrieval.
Current usage metrics show cumulative count of Article Views (full-text article views including HTML views, PDF and ePub downloads, according to the available data) and Abstracts Views on Vision4Press platform.
Data correspond to usage on the plateform after 2015. The current usage metrics is available 48-96 hours after online publication and is updated daily on week days.
Initial download of the metrics may take a while.