Fig. 2
Download original image
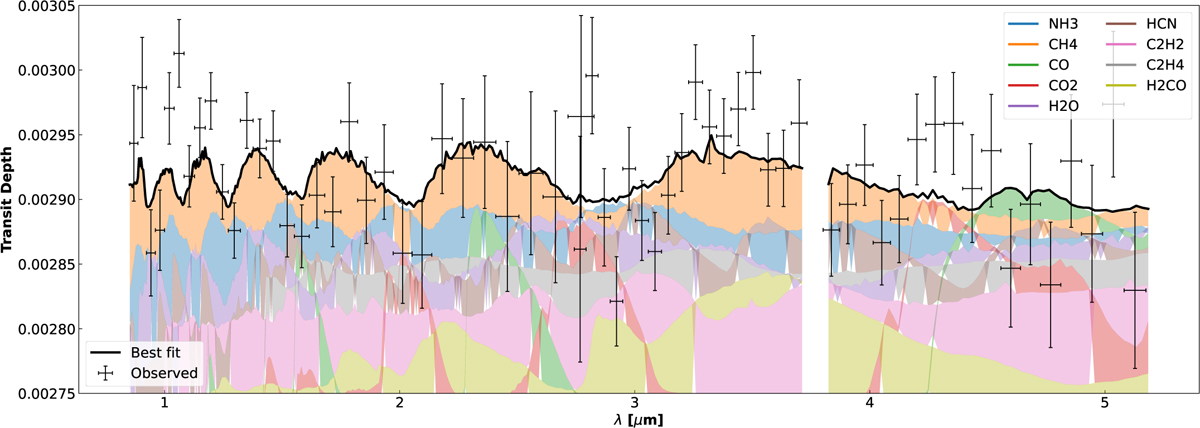
Transit spectra of the best-fit non-equilibrium 1D model at resolution 200 (black solid line). This is the approximate best fit on the simulated grid of metallicity, C/O, and Kzz; the values are respectively 280.7, 90.0, and 106 cm2 s−1. They are compared to a K2–18 b observation (Madhusudhan et al. 2023) low-resolution representation with an offset of −41 ppm between NIRISS and NIRSpec data. The contributions of the considered molecules are represented as shaded colors.
Current usage metrics show cumulative count of Article Views (full-text article views including HTML views, PDF and ePub downloads, according to the available data) and Abstracts Views on Vision4Press platform.
Data correspond to usage on the plateform after 2015. The current usage metrics is available 48-96 hours after online publication and is updated daily on week days.
Initial download of the metrics may take a while.