Fig. 4
Download original image
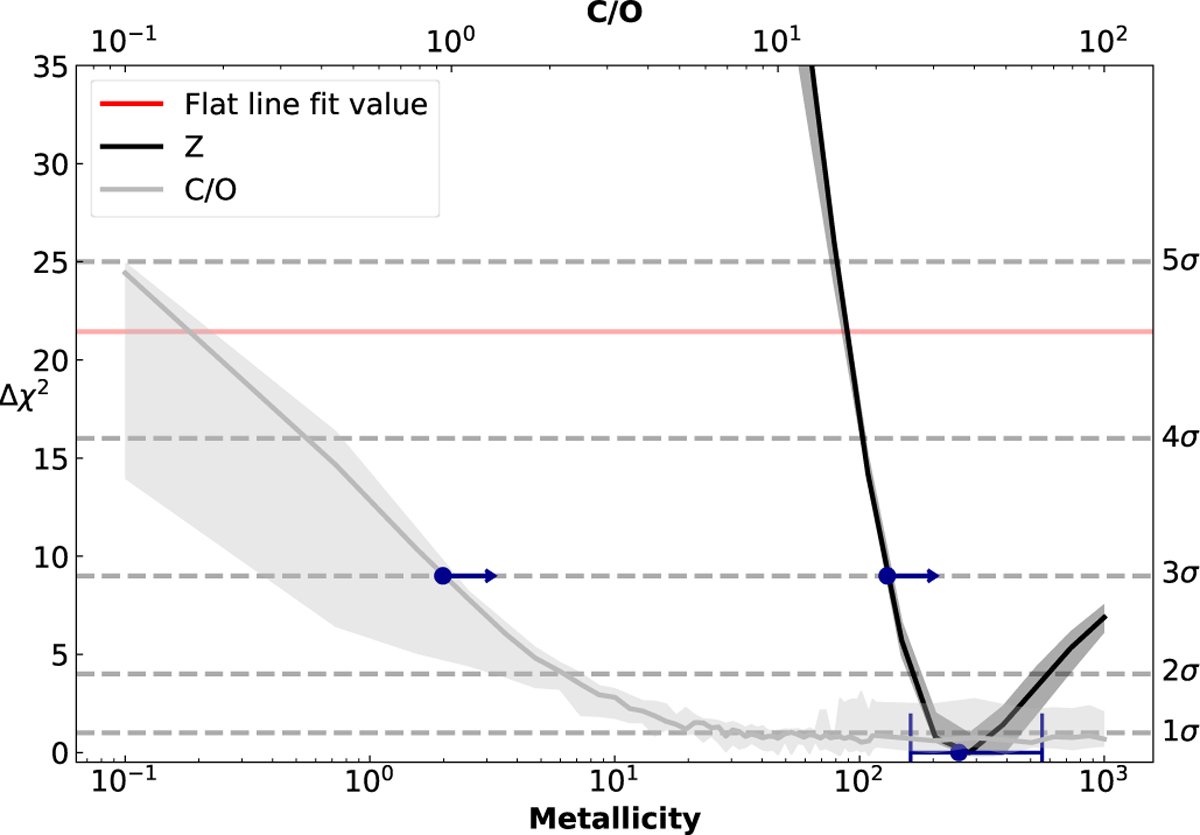
Evolution of Δ χ2 with metallicity or C/O ratio. The χ2 values are computed by comparing 1D chemical models to the K2-18 b observations from Madhusudhan et al. (2023). The Δ χ2 values represent the difference from the best-fit model. The 1D projection is obtained by selecting the lowest χ2 across the other parameter dimension (metallicity or C/O). The shaded area represents the dispersion from Kzz, which has no preferred value (within 1σ), while the solid line indicates the median across Kzz values. The red line represents the Δ χ2 for the best flat-line retrieval, demonstrating a confidence level of the best fit exceeding 4σ. An additional best-fit value with a 2σ uncertainty for metallicity and a lower limit at 3σ for metallicity and C/O are shown in blue, derived from a polynomial fit in log scale.
Current usage metrics show cumulative count of Article Views (full-text article views including HTML views, PDF and ePub downloads, according to the available data) and Abstracts Views on Vision4Press platform.
Data correspond to usage on the plateform after 2015. The current usage metrics is available 48-96 hours after online publication and is updated daily on week days.
Initial download of the metrics may take a while.