Open Access
Fig. 5
Download original image
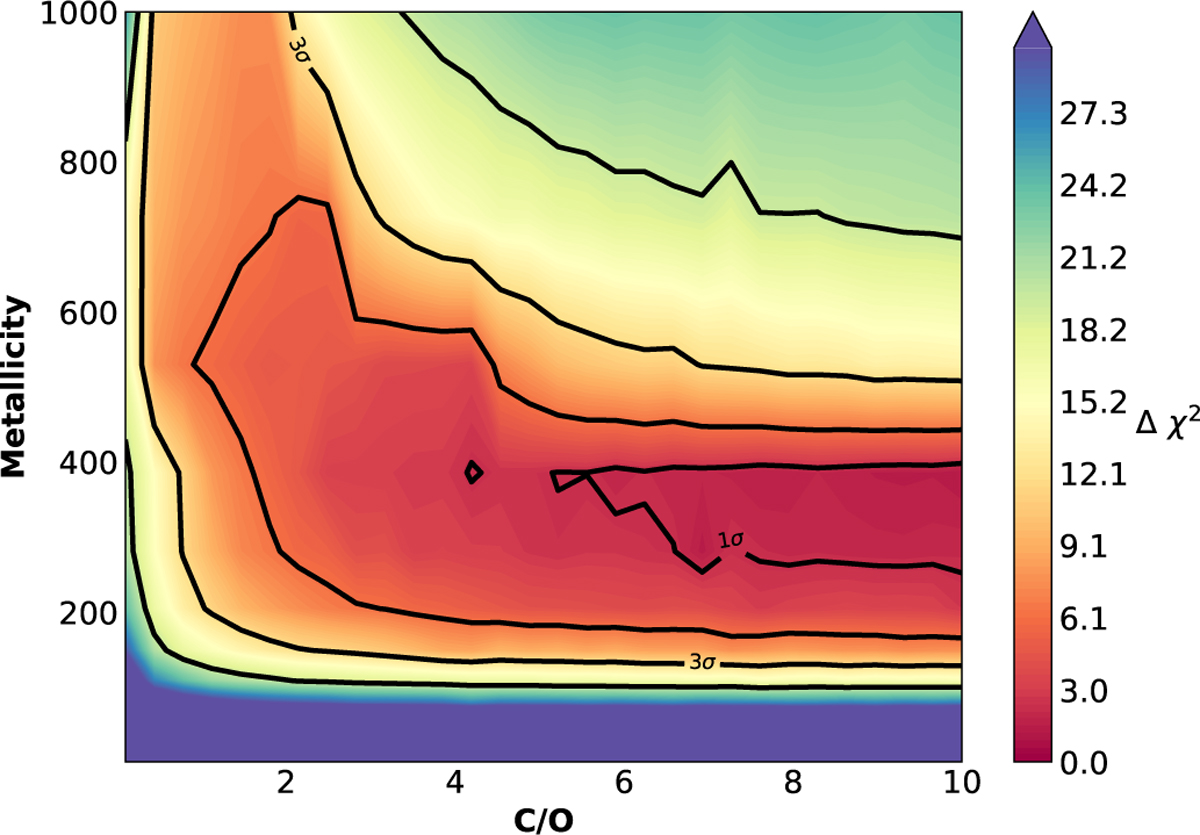
Representation of the Δ χ2 with the best fit compared to the K2-18 b observation (Madhusudhan et al. 2023) and the 1D models. The 2D map goes over the range of metallicity and C/O ratio, collapsed in Kzz with best χ2 values. The 2D map is zoomed for C/O ratio ≤ 10 since above this value it follows the same trend.
Current usage metrics show cumulative count of Article Views (full-text article views including HTML views, PDF and ePub downloads, according to the available data) and Abstracts Views on Vision4Press platform.
Data correspond to usage on the plateform after 2015. The current usage metrics is available 48-96 hours after online publication and is updated daily on week days.
Initial download of the metrics may take a while.