Fig. 1
Download original image
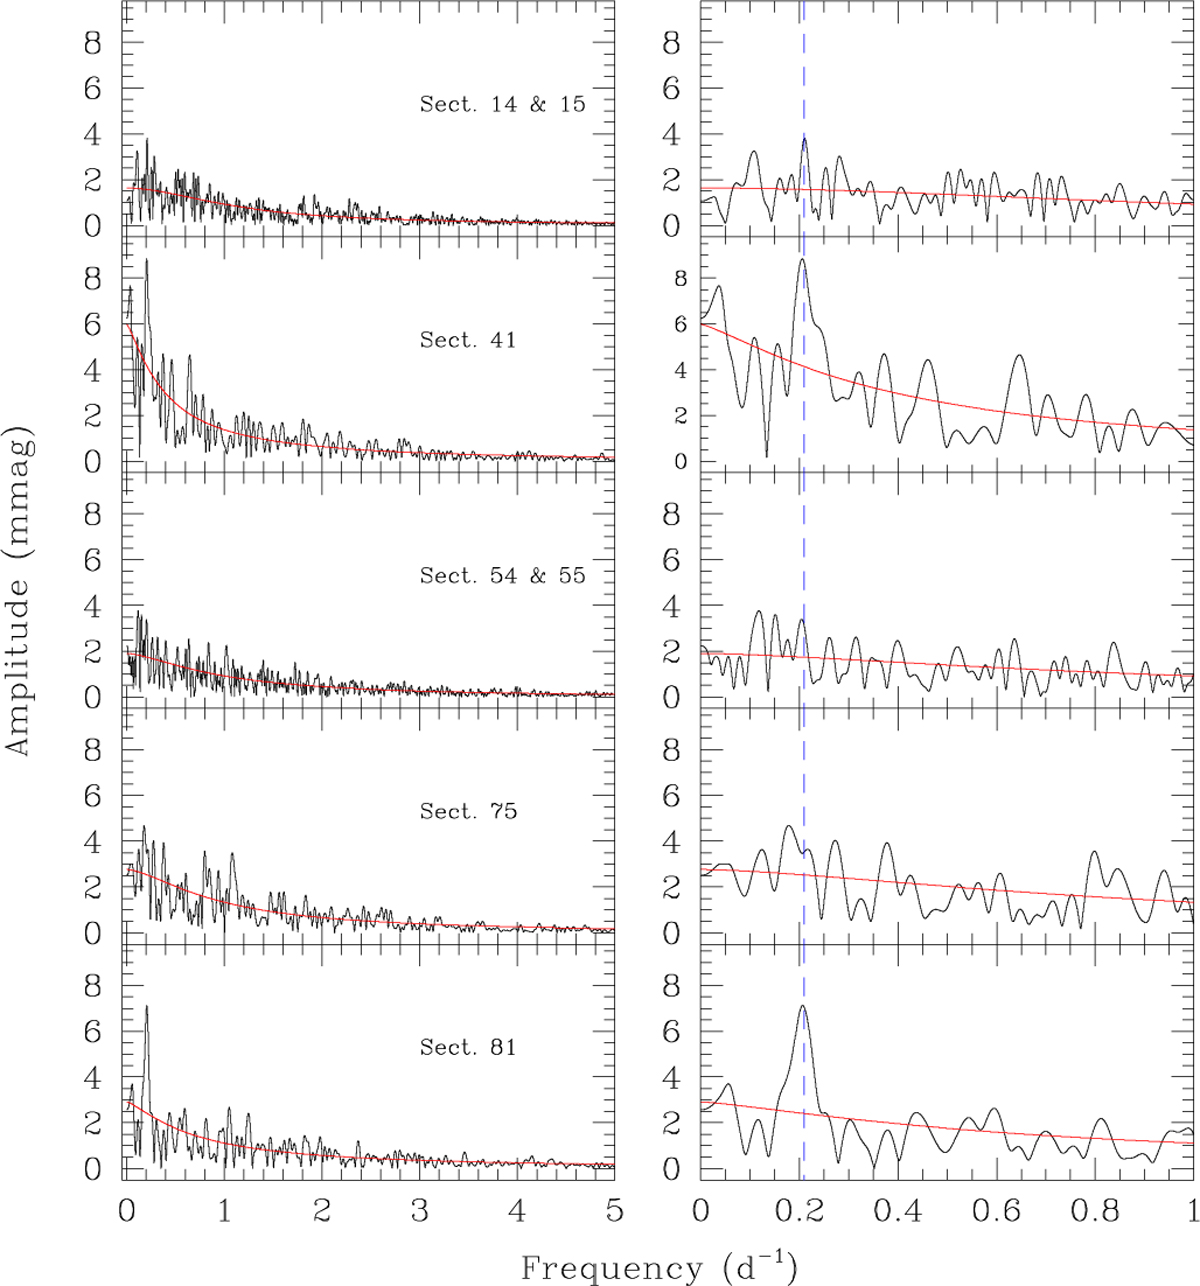
Fourier periodogram of TESS photometry of HD 192639 during the different sectors. The left-hand panels display the periodogram between 0 and 5 d–1 clearly unveiling the red-noise behaviour. The bestfit red-noise relation is shown in red. The right-hand panels provide a zoomed-in view of the region below 1 d–1. The dashed blue vertical line yields the ν1 frequency previously found in spectroscopic time series by Rauw et al. (2001).
Current usage metrics show cumulative count of Article Views (full-text article views including HTML views, PDF and ePub downloads, according to the available data) and Abstracts Views on Vision4Press platform.
Data correspond to usage on the plateform after 2015. The current usage metrics is available 48-96 hours after online publication and is updated daily on week days.
Initial download of the metrics may take a while.