Open Access
Fig. 3
Download original image
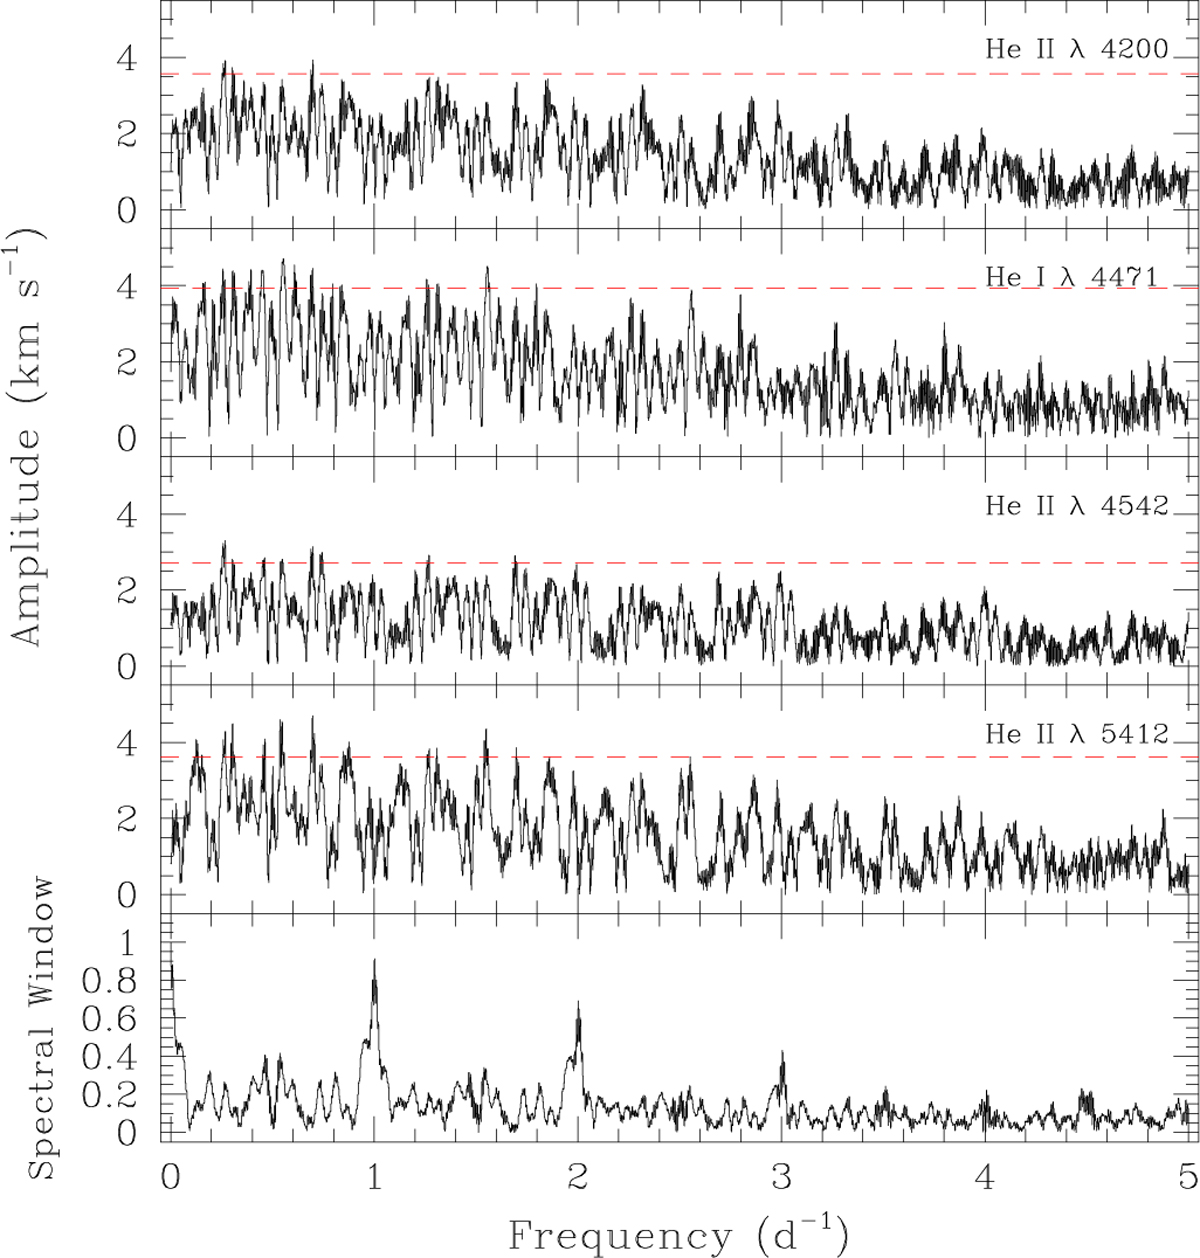
Top four panels: Fourier periodograms of RV time series of He lines in the optical spectrum of HD 192639. The dashed red line yields the 1% significance level (see text). The bottom panel shows the spectral window corresponding to our time series.
Current usage metrics show cumulative count of Article Views (full-text article views including HTML views, PDF and ePub downloads, according to the available data) and Abstracts Views on Vision4Press platform.
Data correspond to usage on the plateform after 2015. The current usage metrics is available 48-96 hours after online publication and is updated daily on week days.
Initial download of the metrics may take a while.