Fig. 4
Download original image
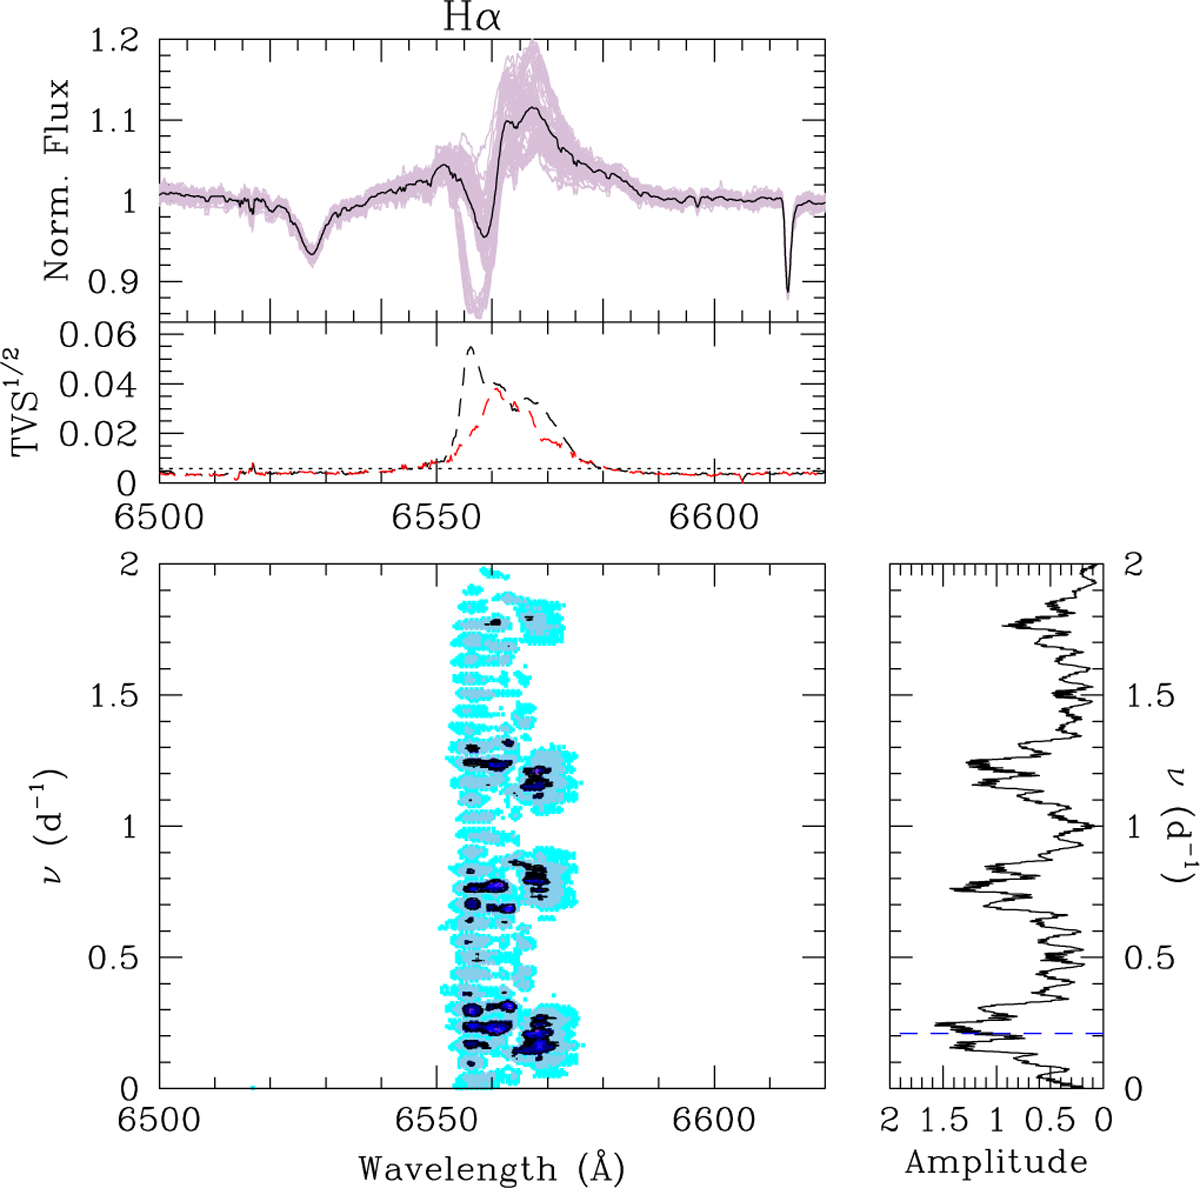
TVS and Fourier analysis of our time series of Hα line profiles. The top panel illustrates the mean profile on top of all the individual profiles (grey) as well as the TVS1/2 (dashed line). The dotted line corresponds to the 1% significance level assessed from the S/N of the data in the continuum. A TVS1/2 level above this threshold has a less than 1% probability of being due to a noise fluctuation. The dashed red line corresponds to the TVS1/2 evaluated excluding the observations taken during the nights affected by the trough event (from HJD 2459422.6 to 2459425.9). The bottom left panel provides the Fourier periodogram as a function of wavelength divided by the 1% significance level. The colours indicate ratios of 0.5 (cyan), 1.0 (medium blue), 2.0 (dark blue), and 3.0 (violet). The periodogram divided by the 1% significance level averaged over the wavelength interval where significant variability occurs is shown by the rightmost panel. The dashed blue line corresponds to v1.
Current usage metrics show cumulative count of Article Views (full-text article views including HTML views, PDF and ePub downloads, according to the available data) and Abstracts Views on Vision4Press platform.
Data correspond to usage on the plateform after 2015. The current usage metrics is available 48-96 hours after online publication and is updated daily on week days.
Initial download of the metrics may take a while.