Fig. 5
Download original image
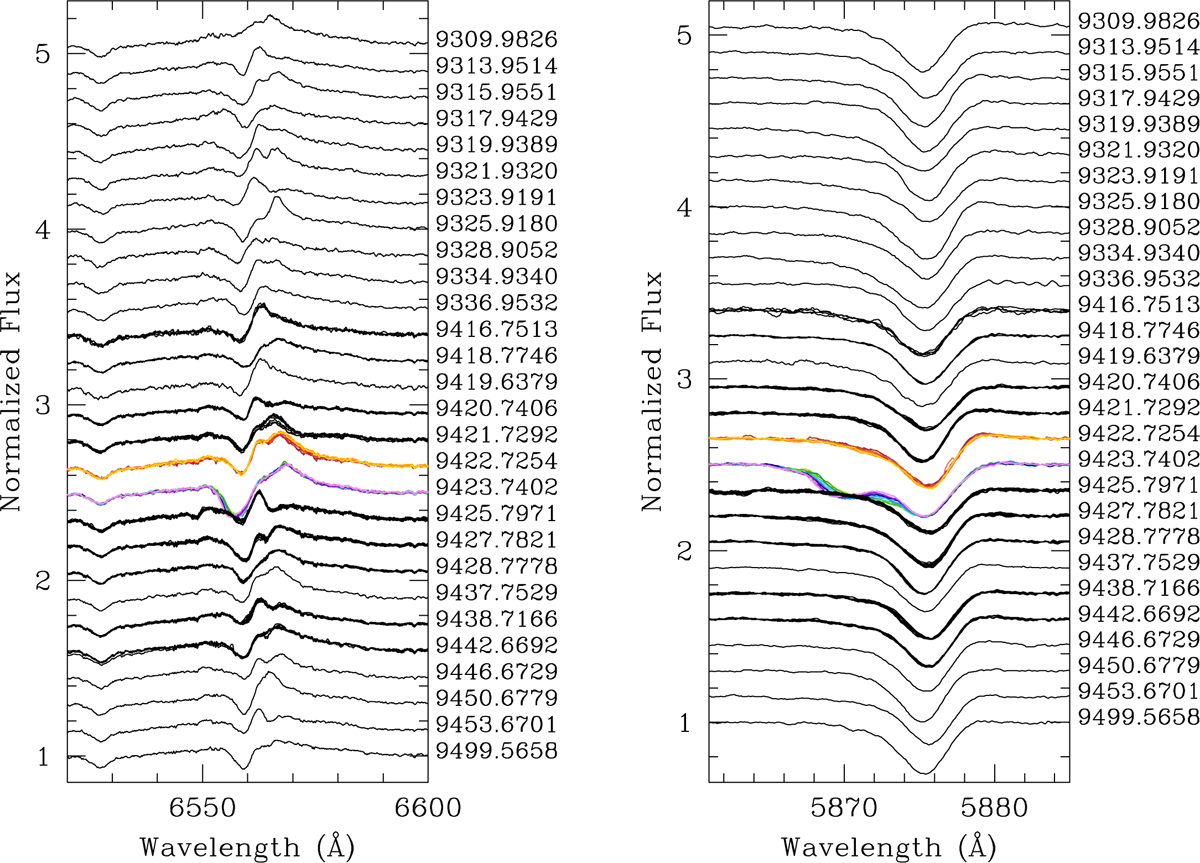
Illustration of lpv of Hα (left panel) and He I λ 5876 (right panel) lines in our TIGRE/HEROS spectra of HD 192639. The date of the observation is given on the right of each panel in the HJD-2450000 format. For nights with more than one observation, the various spectra are overplotted and the date corresponds to the mean time at mid exposure of all the spectra taken that night. The spectra displayed in orange-red and green-blue colours were taken during the trough seen in the TESS light curve of Sector 41.
Current usage metrics show cumulative count of Article Views (full-text article views including HTML views, PDF and ePub downloads, according to the available data) and Abstracts Views on Vision4Press platform.
Data correspond to usage on the plateform after 2015. The current usage metrics is available 48-96 hours after online publication and is updated daily on week days.
Initial download of the metrics may take a while.