Fig. 6
Download original image
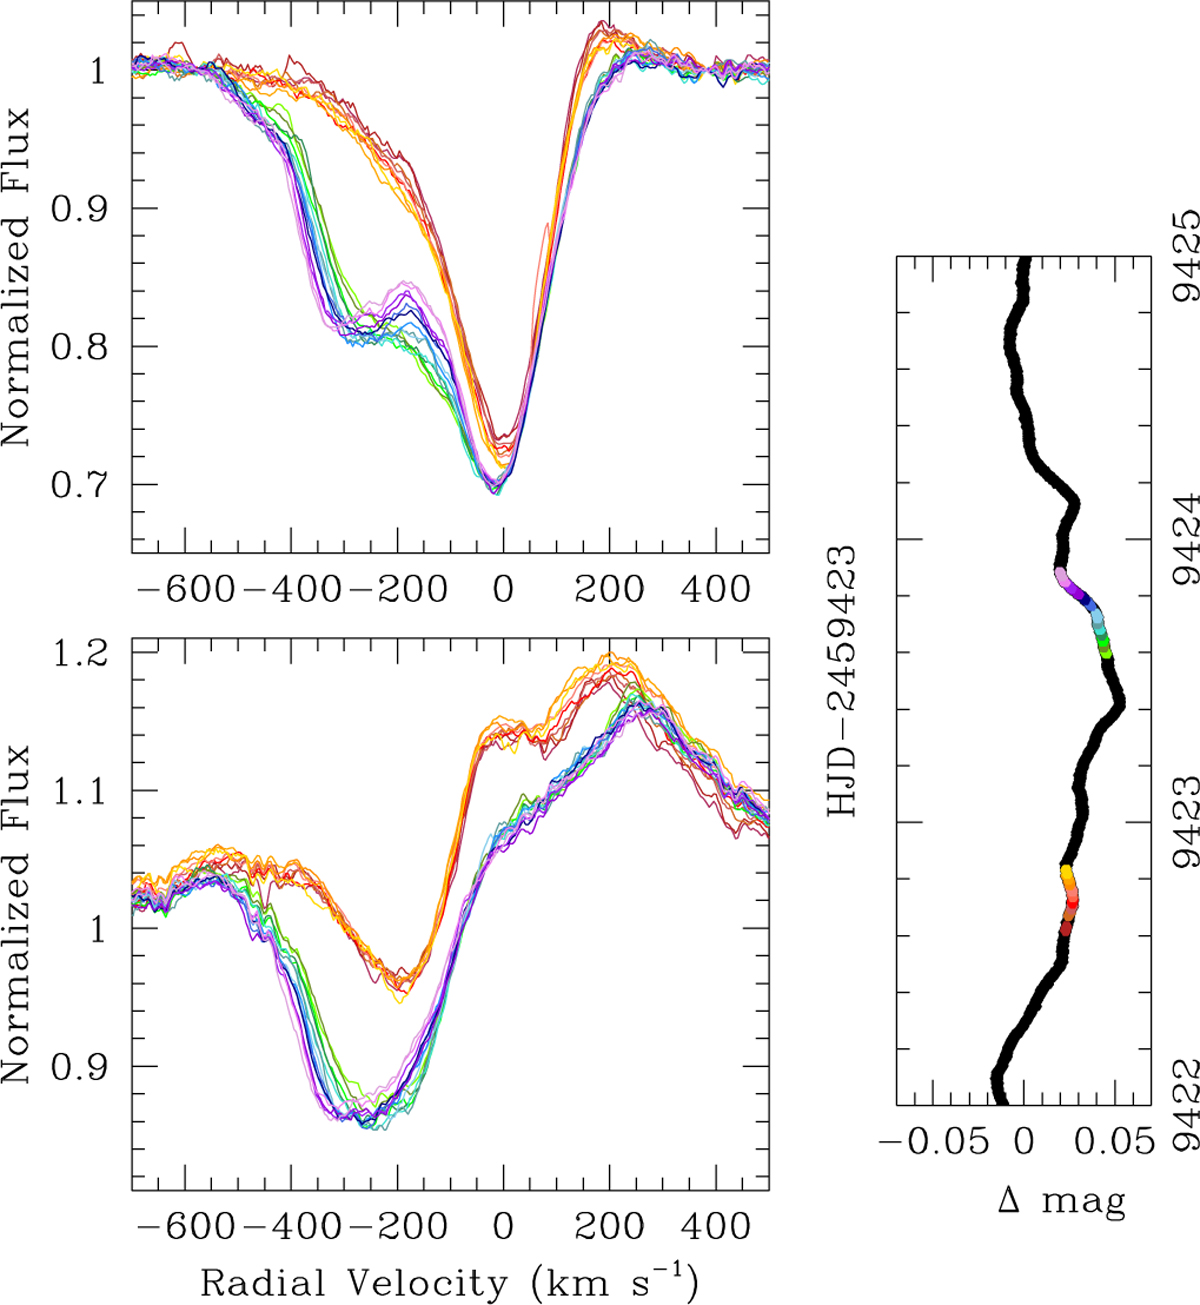
Details of lpv during the trough event in TESS photometry. The top panel illustrates the variations of He I λ 5876, whilst the bottom panel displays those of Hα. The different colours correspond to different observations taken during the nights of 26–27 and 27–28 July 2021. The vertical panel on the right displays the TESS light curve. The colours of the symbols correspond to those used for the spectra.
Current usage metrics show cumulative count of Article Views (full-text article views including HTML views, PDF and ePub downloads, according to the available data) and Abstracts Views on Vision4Press platform.
Data correspond to usage on the plateform after 2015. The current usage metrics is available 48-96 hours after online publication and is updated daily on week days.
Initial download of the metrics may take a while.